We Build Clarity
ApexData is a developer-focused platform for real-time application & infrastructure insights at scale
This is not yet another SRE AI Agent
yet we have agentsOur main feature is not a discount to Datadog
yet we offer more value at a lower costOur core AI ability is not a root-cause analysis
yet we do it
When every incident becomes a development bottleneck
When the app goes down, DevOps teams restore service quickly, but deeper issues are handed off to developers for investigation.
Engineering teams lose 20% of their time due to this troubleshooting.
This is $2.5M annually per 100 developers.
Current and emerging tools fail to solve these challenges.

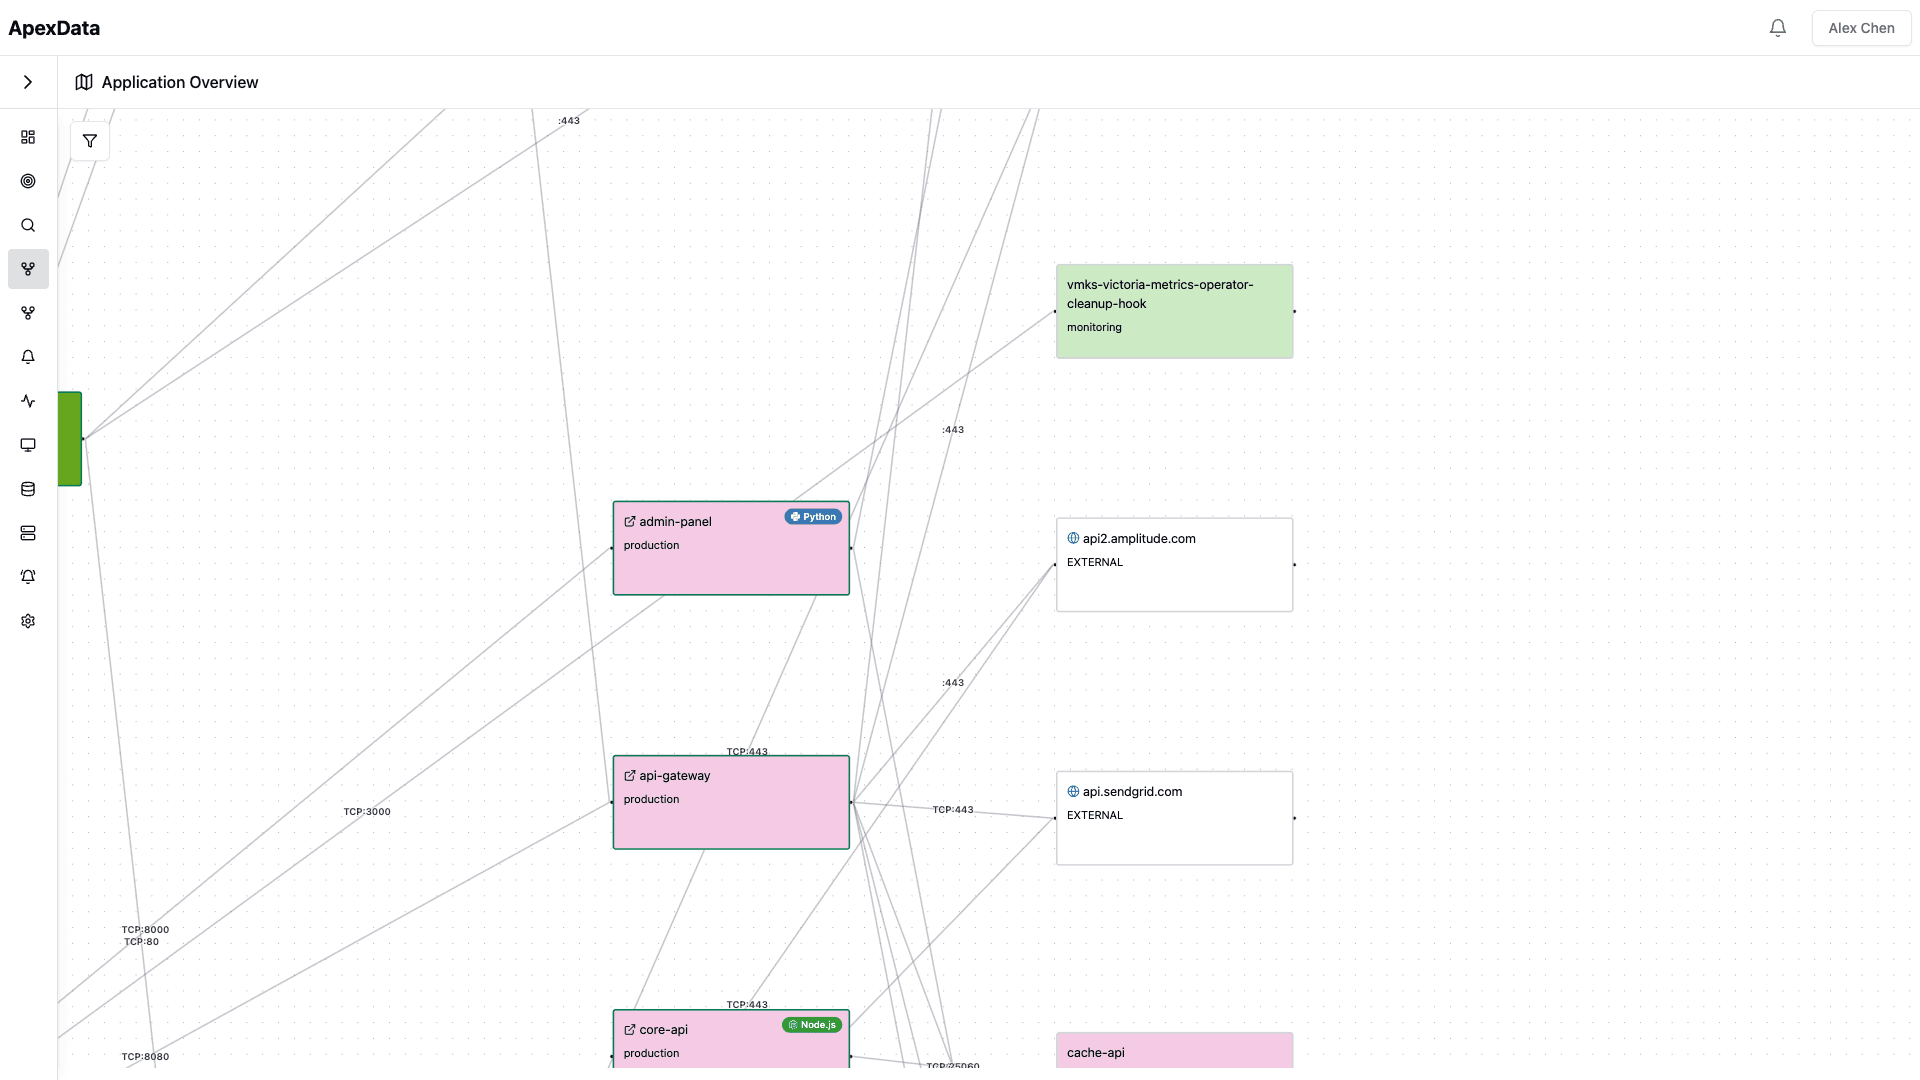
Developers need visualisation tools and data to investigate the issue
Debugging requires clear visualization and precise data.
For five microservices connected, there are 320 possible paths, 50 of which might be related to the issue. To go over all of them is humanely impossible.
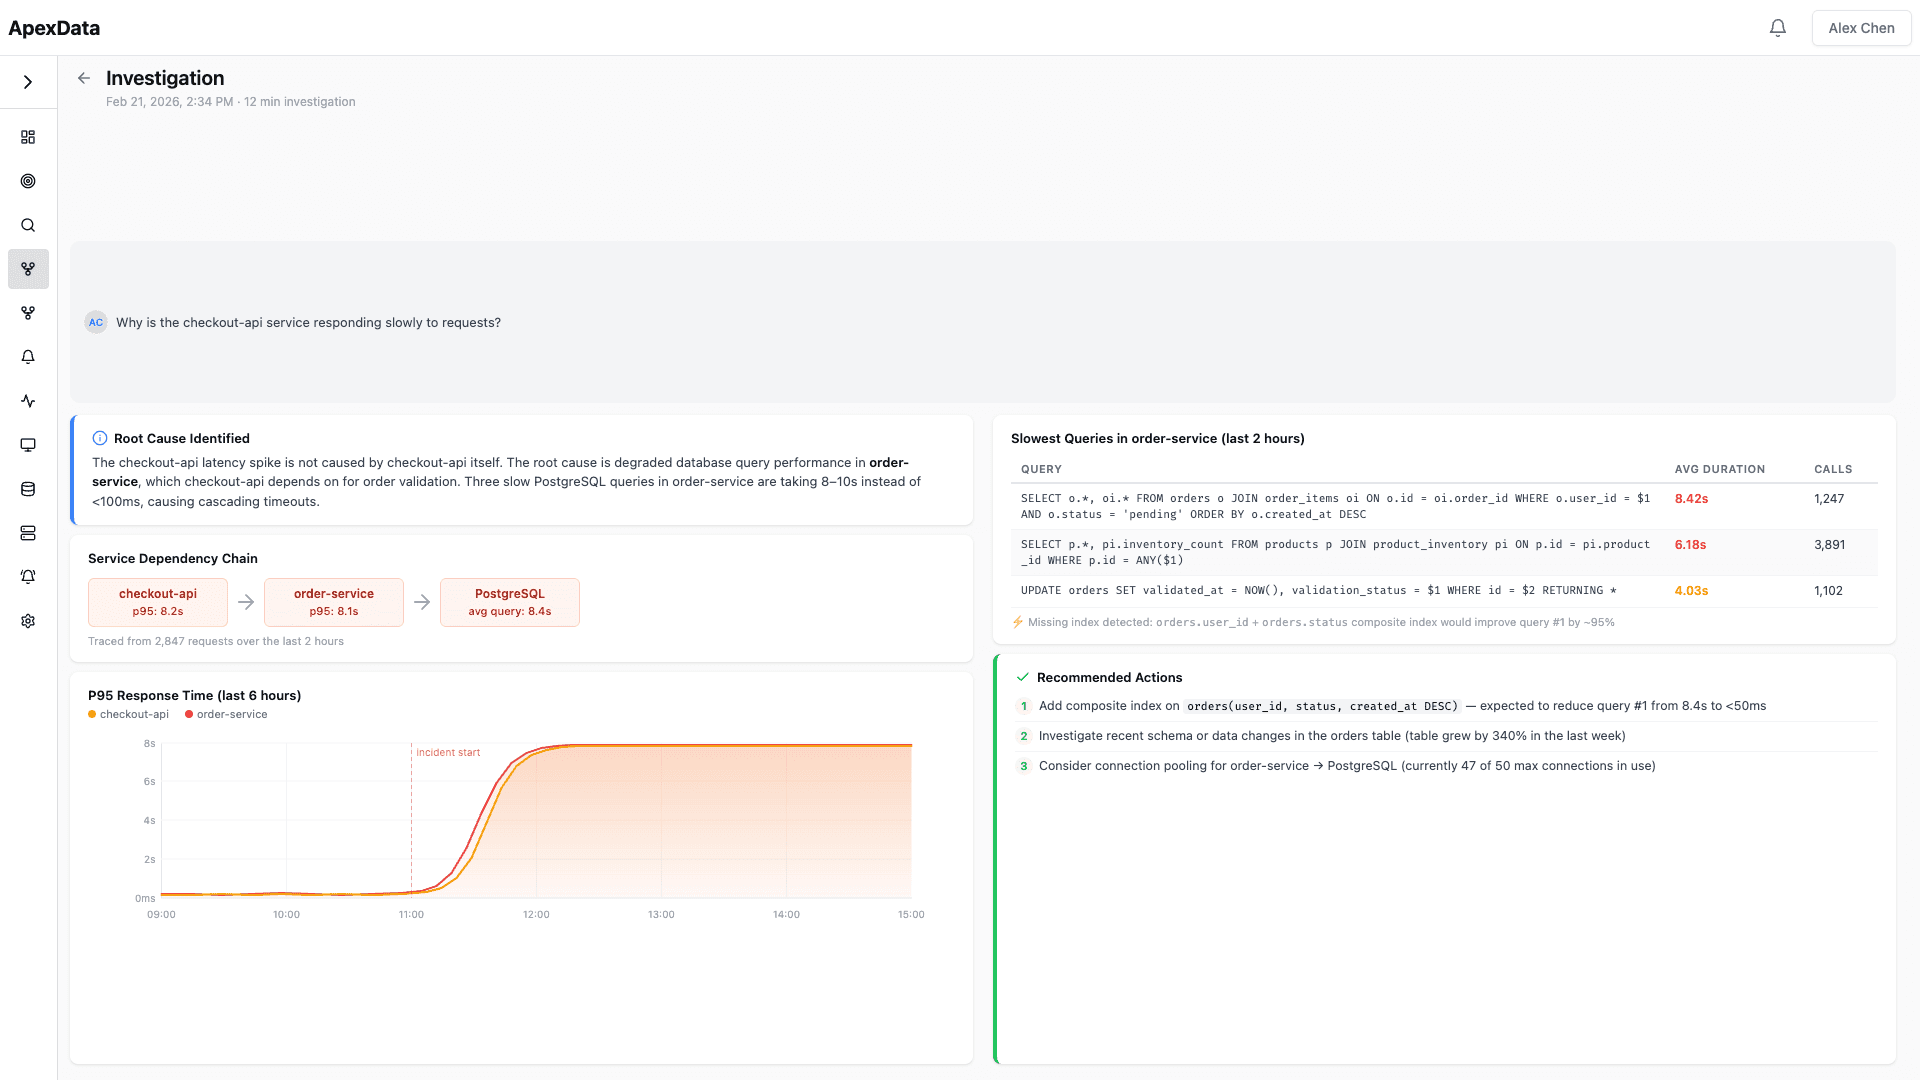
We solve this.
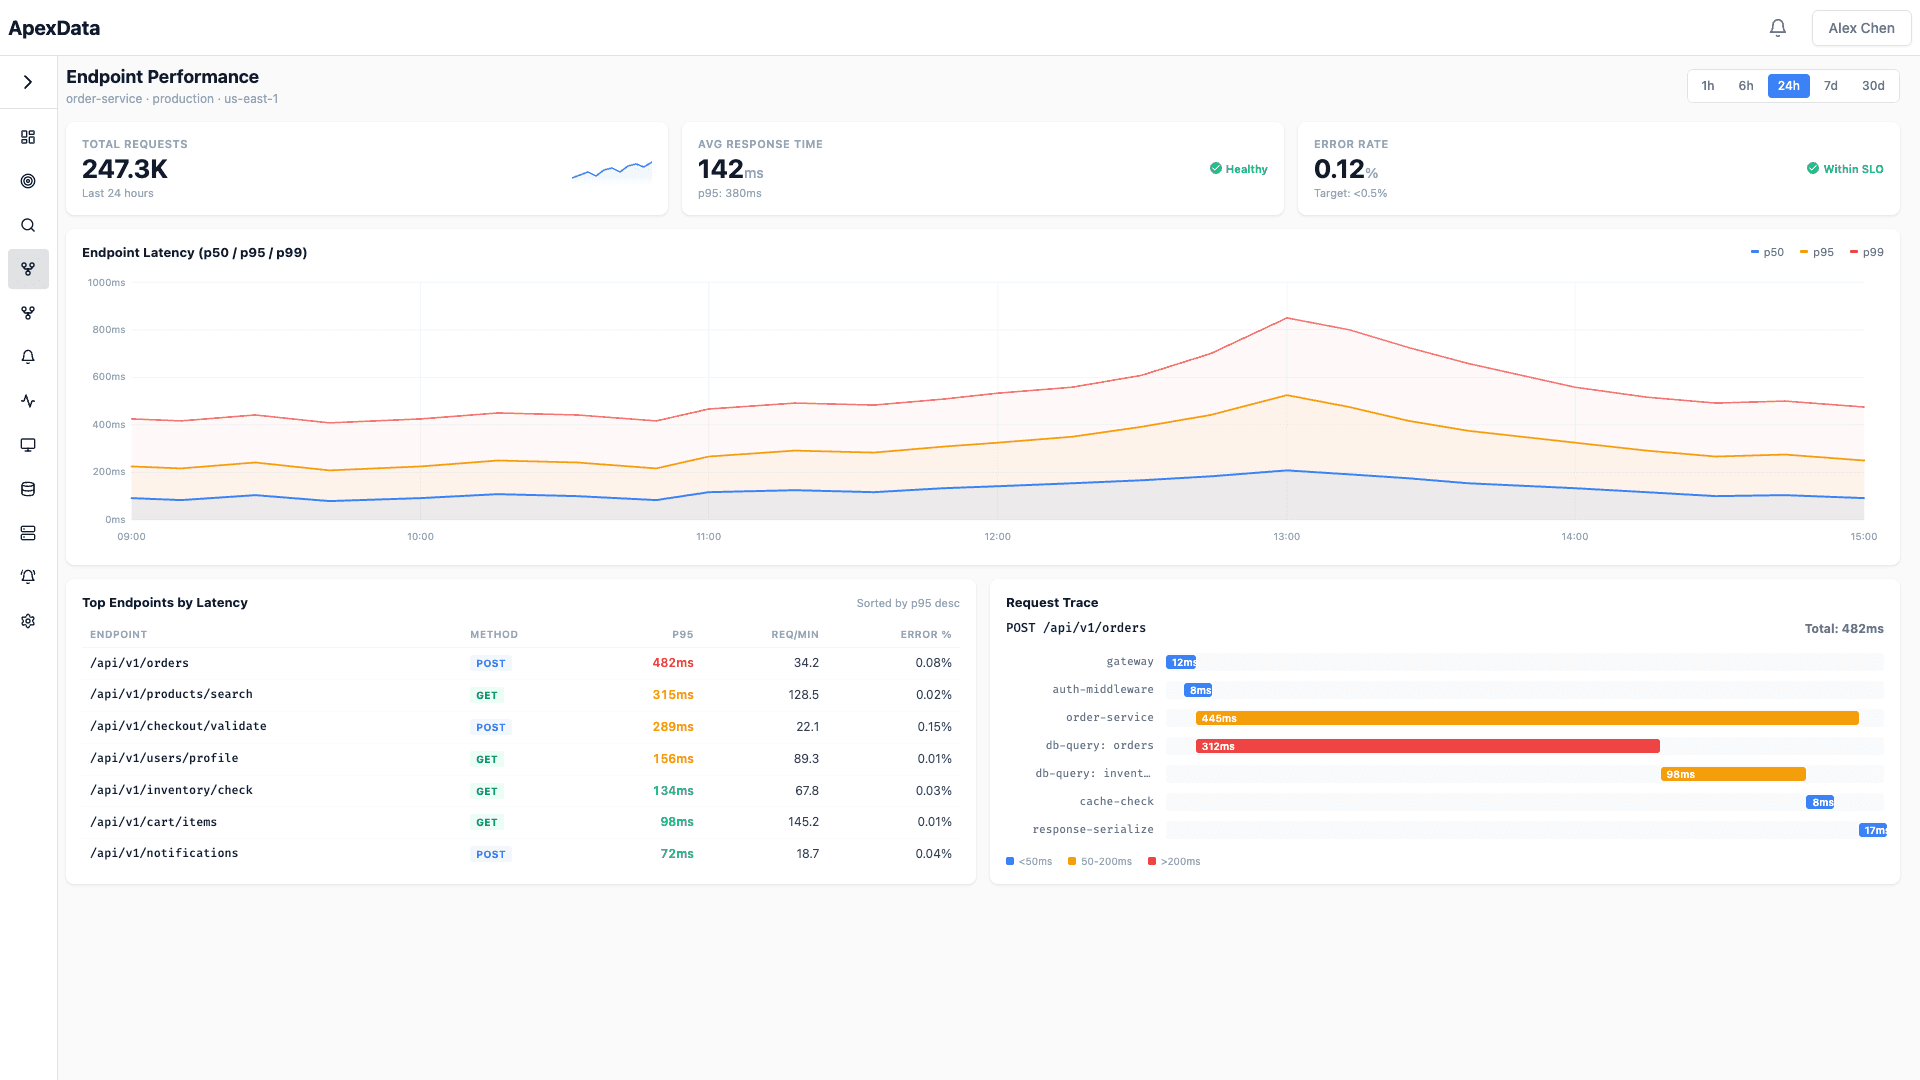
Our agent builds the right dashboard for each incident — you just describe the problem.

Like a senior engineer who already knows your system
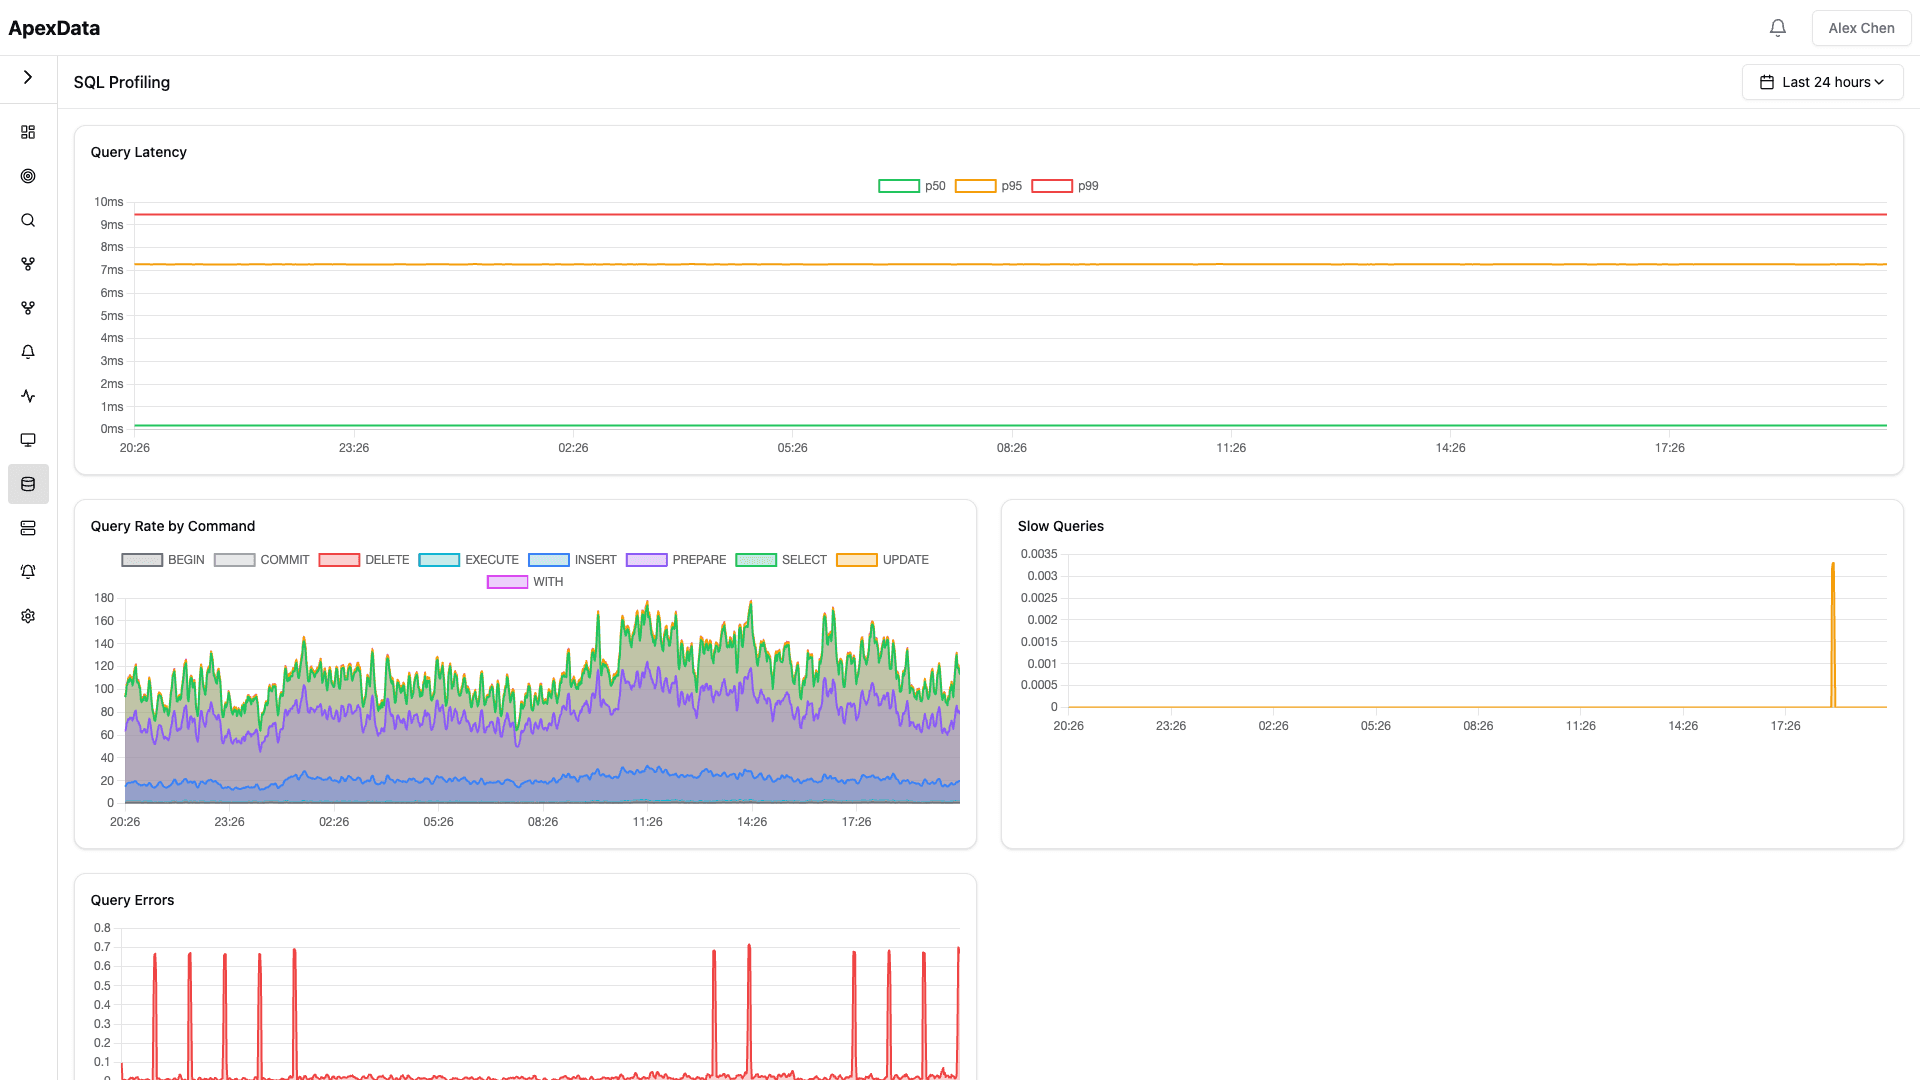
Your current observability tools show metrics.
They don't connect the dots.
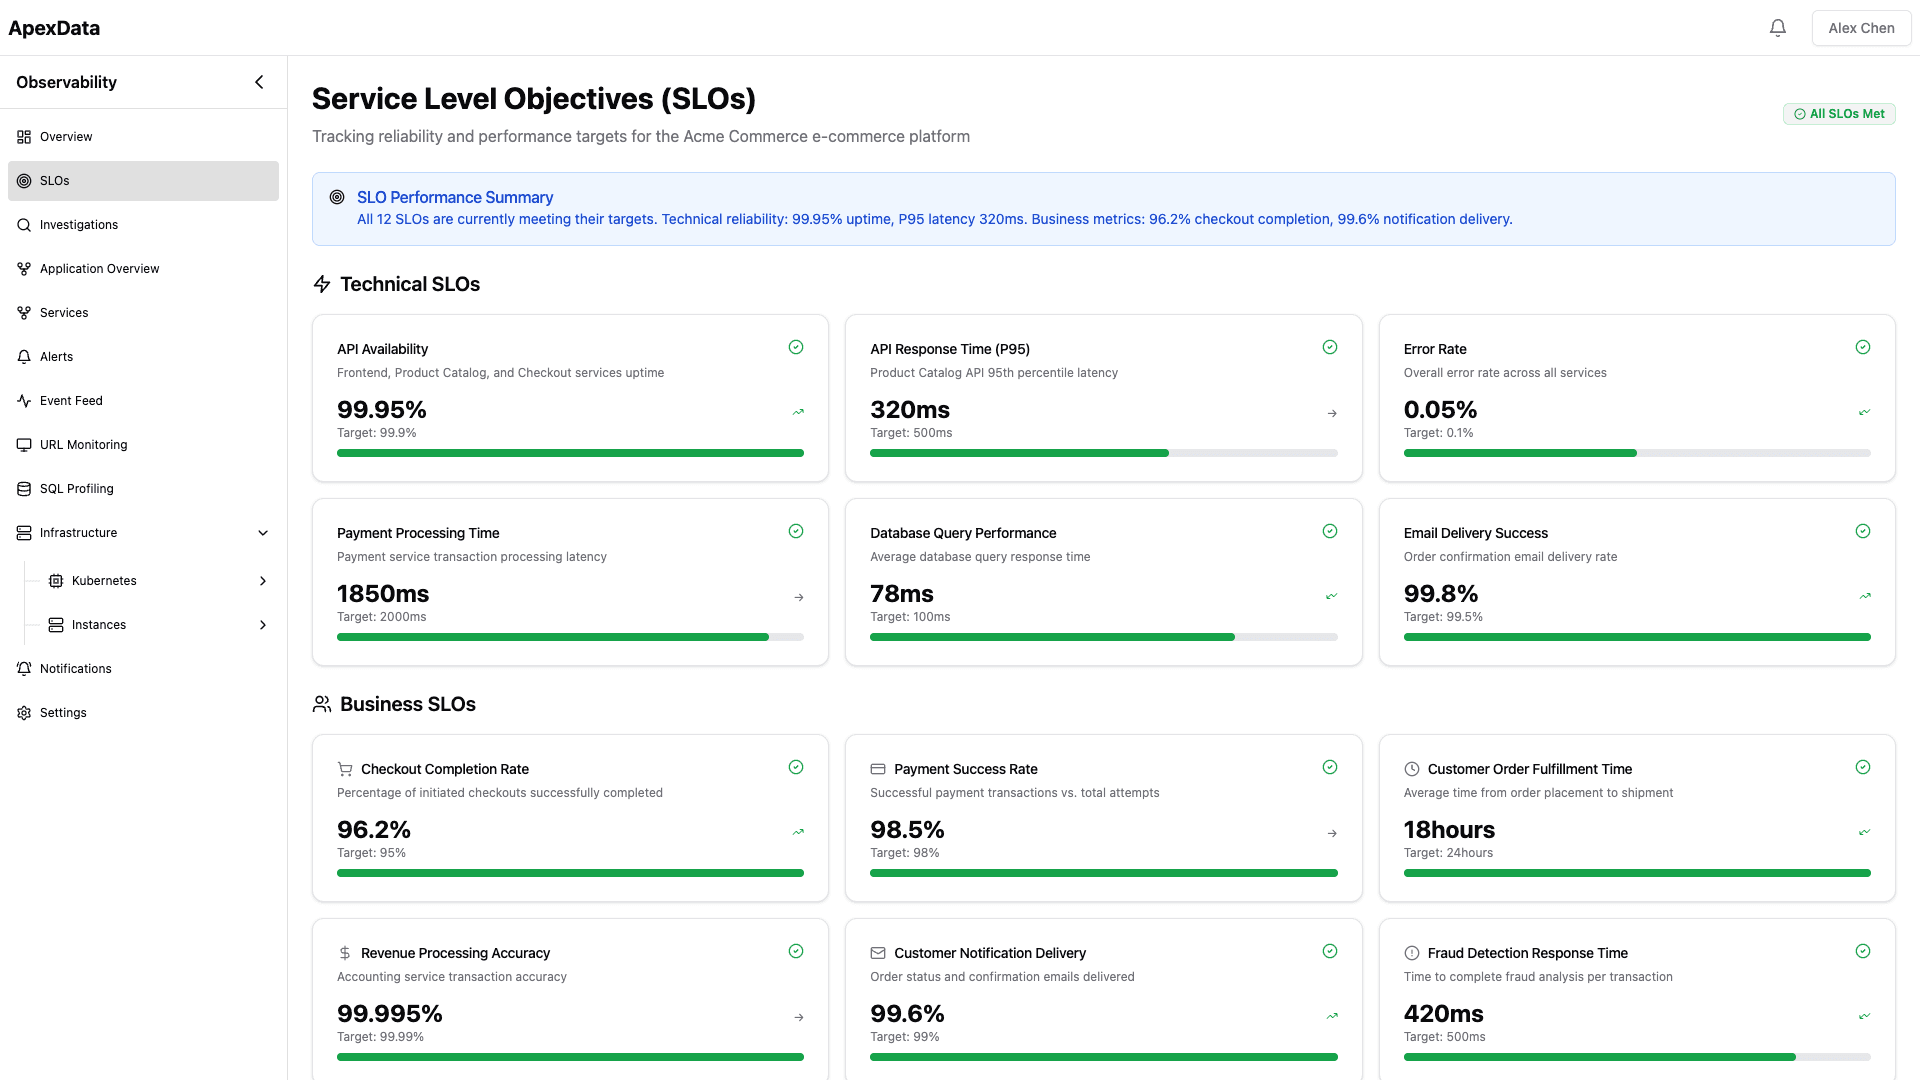
ApexData maps dependencies across your services and infrastructure in real-time.
When something breaks, you see the actual problem — not just symptoms. Built on 20 years of reliability engineering.

Instant visibility, zero setup
ApexData is engineered for large Kubernetes environments.
You can start immediately with zero instrumentation required.
Connect your cluster. Monitor infrastructure metrics, APM traces, and container health — without touching your code.
Cost-Effective Observability That Makes Sense
Transparent volume-based pricing with no infrastructure penalties
Real support. Real people
Our team is available when you need them. Engineers and founders — not ticket queues
Dedicated 24/7 Support
No ticket ping-pong. No waiting for escalations. You talk directly to engineers and founders who understand your setup. Questions get answered in minutes, not days.
We're available 24/7 — real people, not bots.
Hands-on training
Skip the generic webinars and documentation links. We train your team directly — on your infrastructure, your workflows, your actual use cases. Sessions are live, interactive, and tailored to your stack.
Guided onboarding process
We don't just hand you credentials and walk away. Our team guides you through setup, integration, and optimization.
Full onboarding takes 1 to 4 weeks depending on your team size and infrastructure complexity.
Custom development available
Your infrastructure has unique requirements. We build custom integrations, connectors, and features that fit your exact needs.
Our engineers work directly with your team to deliver.
