See Every Service Connection Instantly.
No config files. No annotations
ApexData uses eBPF to build a real-time dependency map of your entire cluster — automatically discovering services, connections, and traffic flows
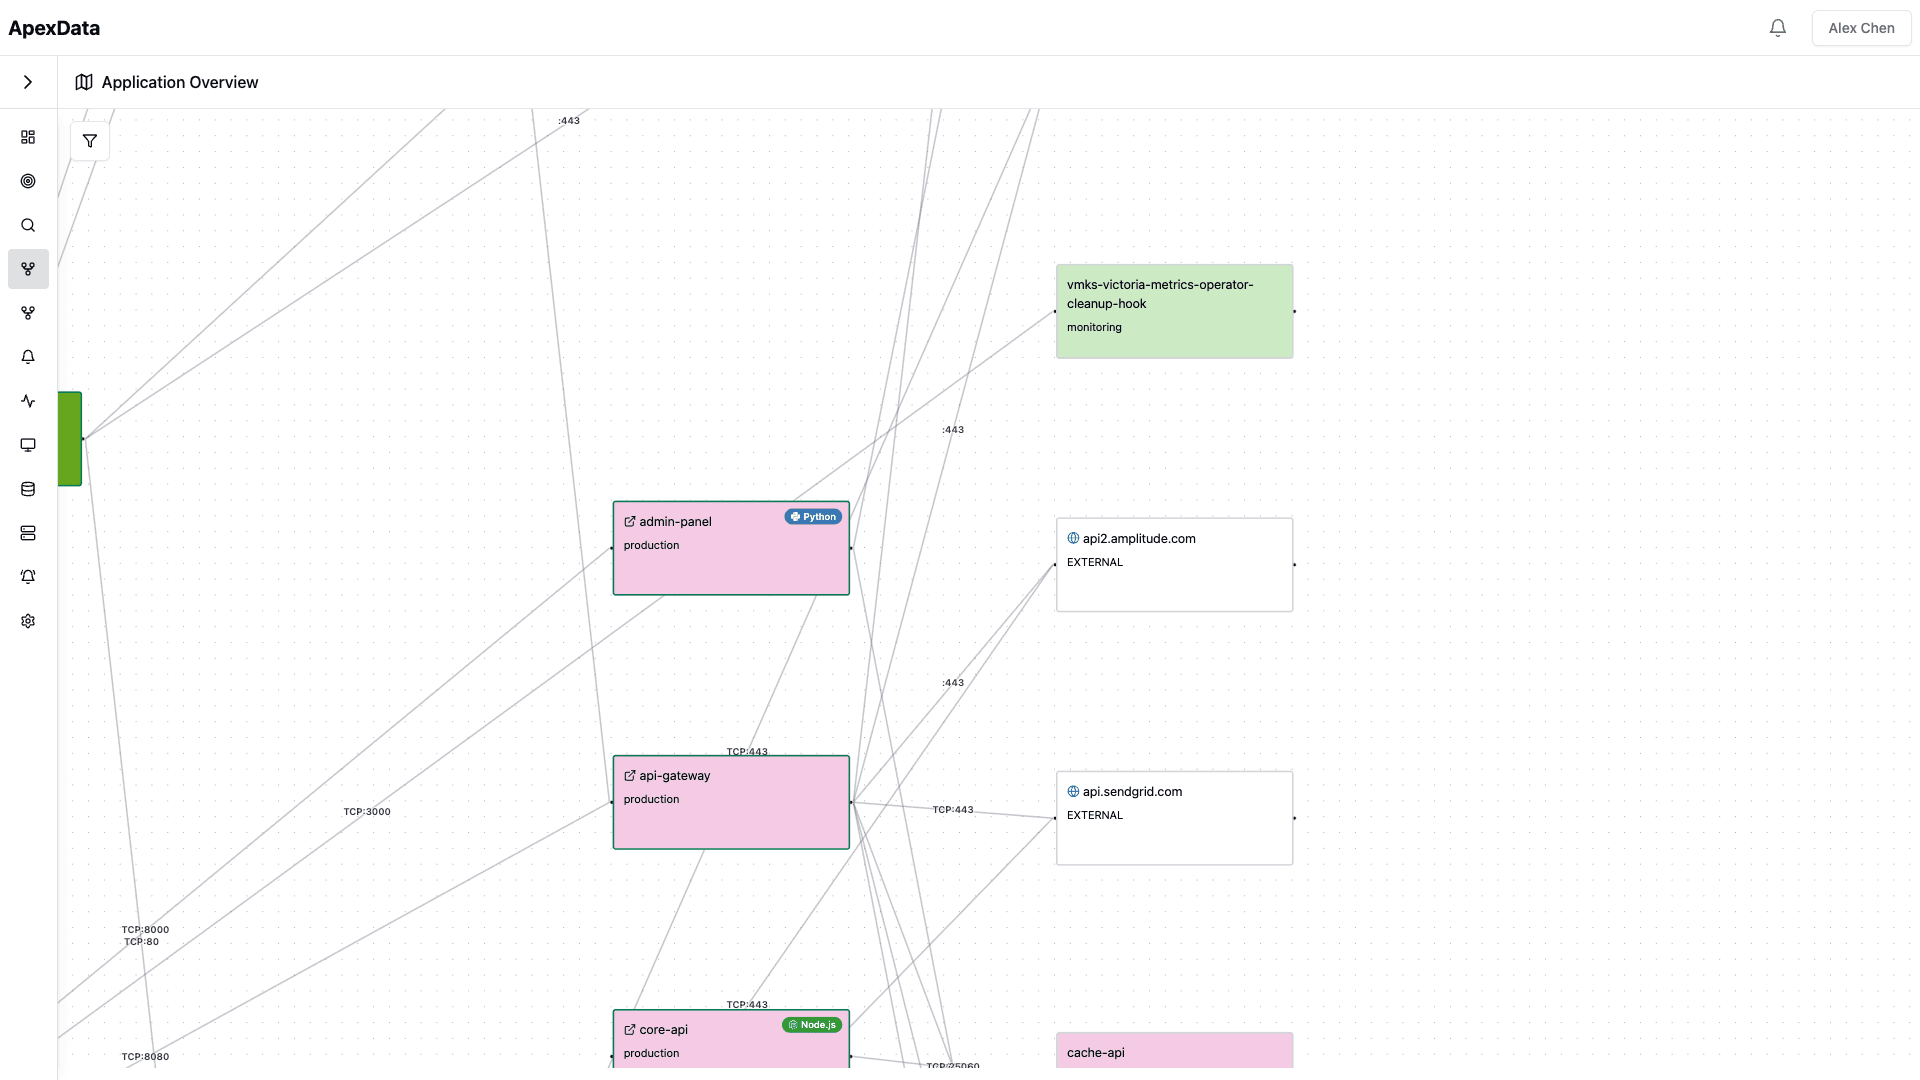
Real-time service topology.
Not stale diagrams
From auto-discovery to anomaly detection on service edges — a living map of your infrastructure
🔍 Auto-Discovery
Every service, pod, and external dependency is discovered automatically from real network traffic. No manual registration or service catalogs to maintain.
🔗 Real-Time Topology
A continuously updated map of how your services communicate. See the actual topology, not what someone documented six months ago.
📊 Traffic Flow Visualization
See request volume, latency, and error rates on every connection edge. Identify bottlenecks and understand traffic patterns at a glance.
⚡ Anomaly Detection on Edges
AI monitors every service connection for unusual patterns — latency spikes, error rate increases, or unexpected traffic shifts.
🌍 Namespace & Cluster Views
Zoom from cluster-wide overview to individual namespace or drill into a single service and its direct dependencies.
📋 API Endpoint Mapping
Go beyond service-level topology. See which specific API endpoints each service calls, with per-endpoint latency and error rates.
Use ApexData for…
🎓 New Engineer Onboarding
Give new team members an interactive map of your entire architecture. No more reading outdated wiki pages or asking five people how services connect.
🔀 Migration Planning
Identify all consumers of a service before migrating. See the real dependency chain, not what was documented when the service was built.
⚡ Incident Scoping
Instantly see the blast radius of a failing service. Trace upstream and downstream dependencies to understand cascading impact.
📊 Capacity Planning
Understand traffic patterns between services. Identify which connections are bottlenecks and where scaling will have the most impact.
🔒 Compliance Auditing
Verify that services communicate only through approved paths. Detect unauthorized connections or unexpected external dependencies.
🏗 Architecture Reviews
Use the live topology as the basis for architecture discussions. Compare actual behavior to intended design.
One platform vs. a stack of tools
Replace the patchwork of monitoring, logging, tracing, and incident management tools with a single AI-powered platform
| Traditional Stack | ApexData | |
|---|---|---|
| Setup | Manually draw and maintain diagrams | Auto-discovered from real traffic, always current |
| Accuracy | Outdated within weeks of creation | Real-time, updated continuously from live traffic |
| Coverage | Only documents known services | Discovers everything including shadow services |
| Granularity | Service-level boxes and arrows | Endpoint-level with latency, errors, and throughput |
| Anomalies | Manual monitoring of each service | AI detects unusual patterns on every connection |
| Multi-cluster | Separate diagrams per environment | Unified view across clusters and namespaces |
| Onboarding | Read docs and hope they're current | Interactive map of the live architecture |
| Maintenance | Dedicated team to keep diagrams updated | Zero maintenance — topology maintains itself |
Why engineers choose ApexData
🧠 Always Current
Unlike manually maintained diagrams, the application map is rebuilt continuously from actual network traffic. It can never go stale.
⚡ Zero Configuration
eBPF-based discovery means no annotations, no sidecars, no service mesh required. Deploy and see your topology immediately.
🔒 Deep Visibility
Goes beyond service names. See endpoint-level traffic, connection latency, error rates, and traffic volume on every edge.
✅ Multi-Cluster Ready
Works across multiple clusters and namespaces. See your entire infrastructure in a single, interactive topology view.