From Alert to Root Cause in Minutes.
Down to the line of code
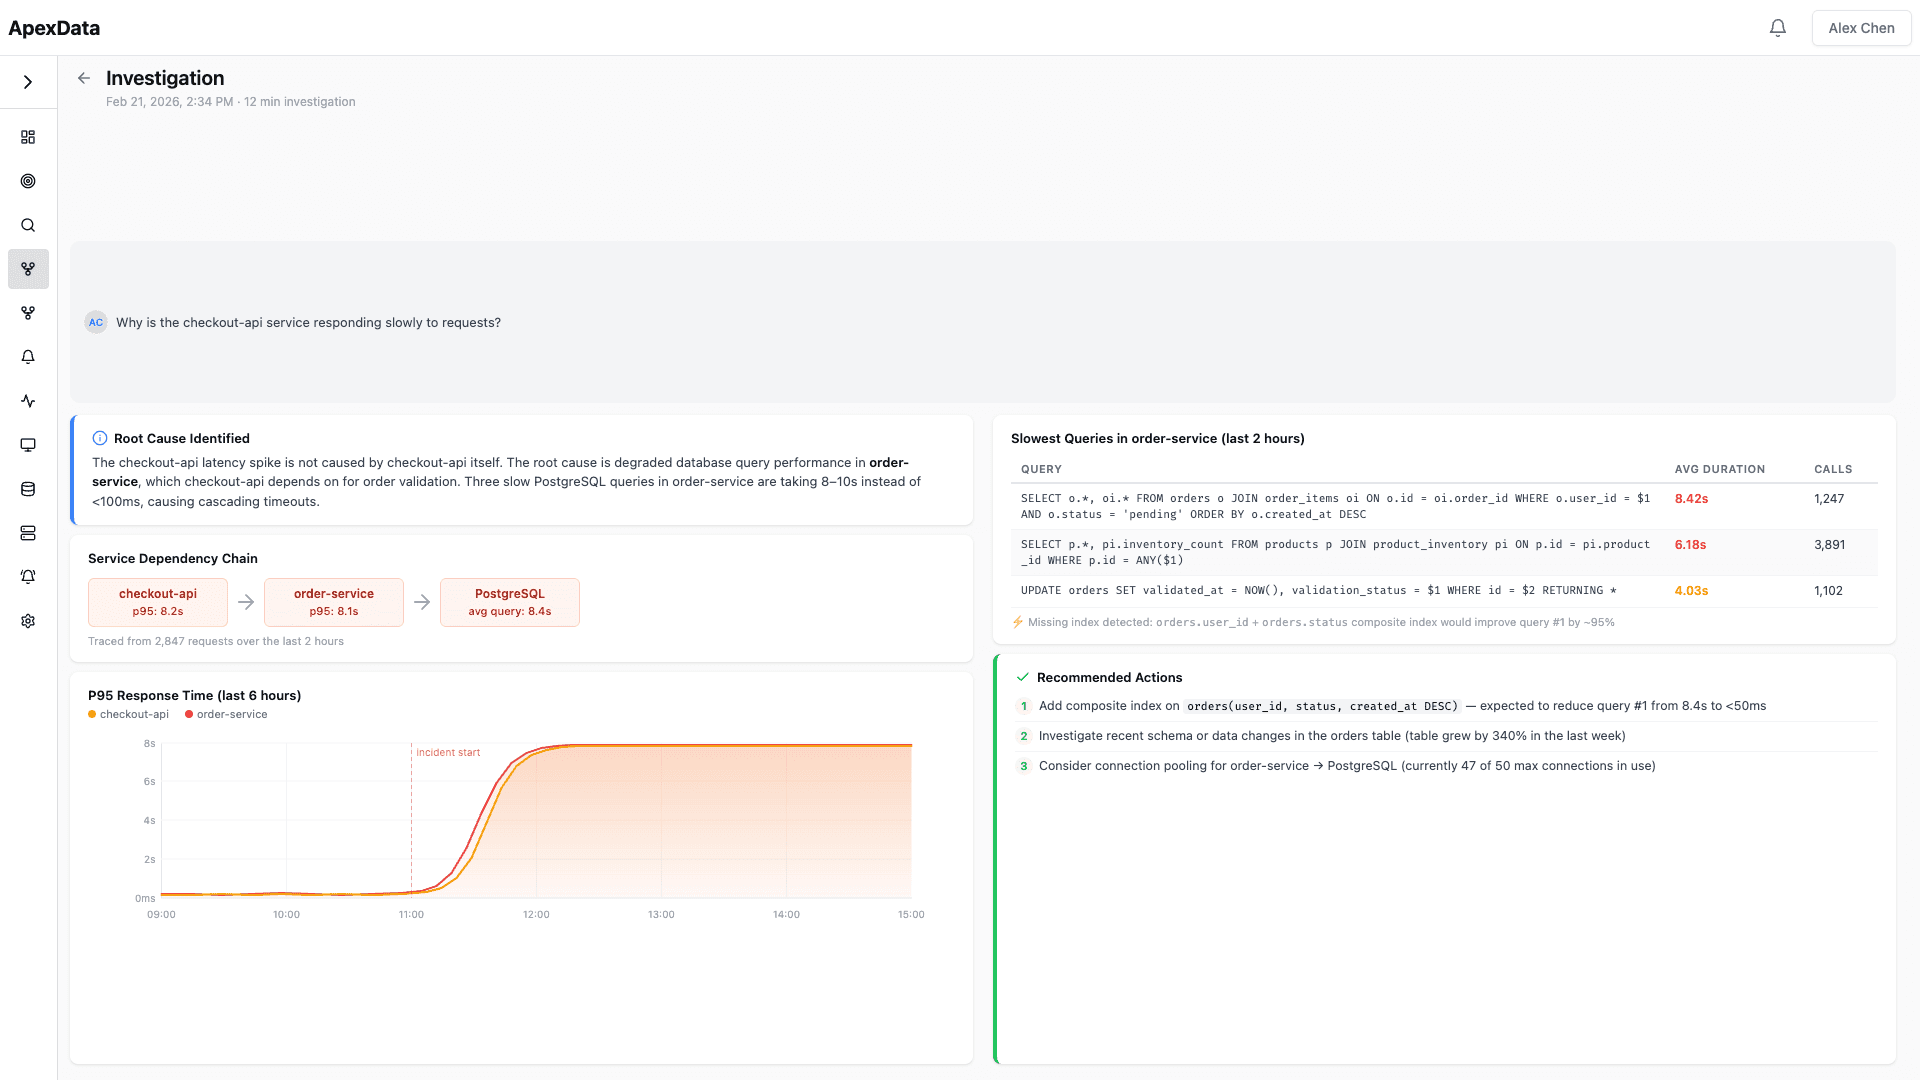
AI agents that investigate incidents across services, traces, and queries — correlating signals your team would take hours to connect
AI-powered root cause analysis.
Not just dashboards
From automated investigation to actionable recommendations — AI that traces through your full stack
🤖 Automated Root Cause Analysis
Describe any problem in natural language. The AI agent builds the right queries, correlates logs, metrics, and traces, and traces the issue through your service mesh to the exact function and line of code.
🔗 Cross-Service Correlation
Incidents rarely stay in one service. The AI agent follows the dependency chain, identifying which upstream or downstream service is the actual source of the problem.
💾 Query Performance Analysis
AI captures and analyzes every database query your services execute. Identifies slow queries, missing indexes, N+1 patterns, and connection pool issues without any code changes.
🔍 Dependency Chain Tracing
See the complete path of a request through your infrastructure. From API gateway to database and back — with latency breakdown at every hop.
✅ Actionable Recommendations
Every investigation produces concrete next steps. Not just "the database is slow" — specific index suggestions, configuration changes, and code references.
📋 Historical Pattern Matching
AI remembers past incidents and their resolutions. When a similar pattern occurs, it immediately surfaces the previous root cause and fix.
Use ApexData for…
⚡ Production Incident Response
From alert to root cause in minutes. AI investigates while your team focuses on remediation, not diagnosis.
📉 Performance Degradation Diagnosis
Trace slow responses through the entire service chain. Pinpoint whether the bottleneck is in code, queries, or infrastructure.
💾 Database Bottleneck Identification
AI analyzes query patterns, identifies missing indexes, and traces slow queries back to the exact ORM call that generates them.
🚀 Deployment Regression Detection
Automatically compare pre- and post-deploy metrics. Catch performance regressions before they impact all users.
📋 SLA Breach Investigation
When SLAs are breached, get a complete investigation report with root cause, timeline, and remediation steps.
📊 Capacity-Related Slowdowns
Distinguish between code issues and capacity limits. AI identifies when scaling, not debugging, is the right response.
One platform vs. a stack of tools
Replace the patchwork of monitoring, logging, tracing, and incident management tools with a single AI-powered platform
| Traditional Stack | ApexData | |
|---|---|---|
| Investigation | Manual correlation across 4–5 tools | AI traces through full stack automatically |
| Root cause depth | “The pod crashed” or “Memory spike” | db.go:247 — connection pool exhausted at maxOpenConns=10 |
| Time to resolve | Hours of manual investigation | Minutes with AI-driven analysis |
| Query analysis | Requires separate APM tool or manual profiling | Automatic SQL capture and analysis via eBPF |
| Cross-service | Tab-switching between service dashboards | Follows dependency chains automatically |
| Historical context | Relies on team memory and past tickets | Pattern matching against previous incidents |
| Recommendations | Generic “check the logs” advice | Specific index suggestions, config changes, code refs |
| Reports | Written manually from memory | Auto-generated with root cause, timeline, and remediation |
Why engineers choose ApexData
🧠 AI-Native Investigation
Investigation isn't a bolt-on feature. It's the core product. AI agents that understand your infrastructure and trace through your entire stack.
⚡ Zero Instrumentation
eBPF-based collection. No code changes, no SDK dependencies, no instrumentation debt. Connect your cluster and see everything.
🔒 Your Infrastructure
Deployed on your cluster, in your VPC. Your data never leaves your infrastructure. SOC 2 Type II compliant.
✅ Production Ready
Battle-tested on production Kubernetes workloads. From startups to enterprise — reliable observability at any scale.
