SLOs That Configure Themselves.
Error budgets that actually work
Automatic SLO tracking based on real traffic patterns — know exactly when your error budget is at risk, which services need attention, and when to slow down releases
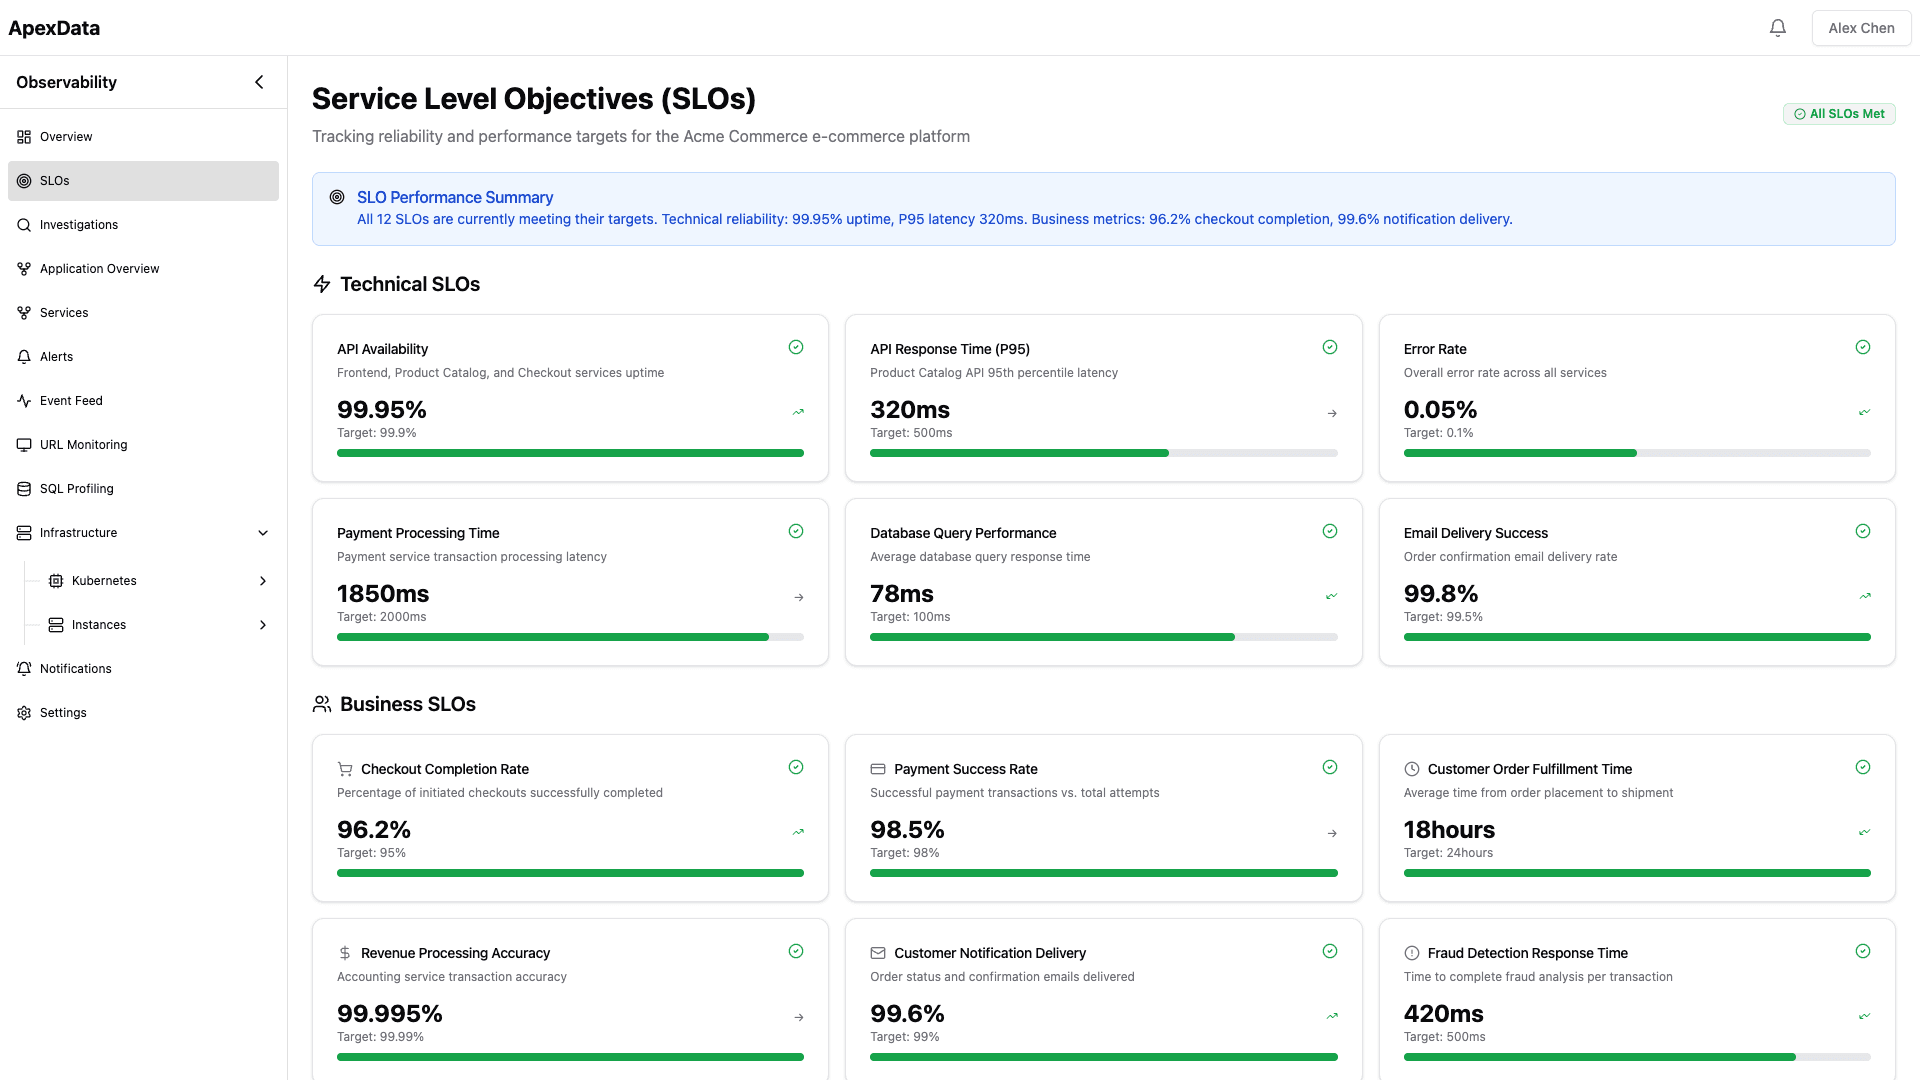
Reliability you can measure.
Not just monitor
From auto-generated SLOs to burn rate alerts — manage service health with data, not guesswork
🤖 Auto-Generated SLOs
ApexData analyzes your actual traffic patterns and generates appropriate SLOs automatically. No more guessing what "four nines" means for each service.
📊 Error Budget Tracking
Real-time error budget consumption with clear burn-down visualization. See exactly how much budget remains and when you need to slow down releases.
⚡ Burn Rate Alerts
Multi-window burn rate alerting that catches real problems while ignoring noise. Get alerted when error budget consumption accelerates — not on every minor blip.
🔍 Multi-Signal SLIs
Build SLIs from multiple signal types — HTTP status codes, latency percentiles, gRPC error rates, and custom metrics. Combine signals for a complete picture of service health.
📋 SLO Dashboards
Purpose-built dashboards for SLO management. At-a-glance service health across your entire organization, with drill-down into individual SLOs.
📈 Reporting & Trends
Weekly and monthly reliability reports generated automatically. Track reliability improvements over time and share progress with leadership.
Use ApexData for…
🎯 Reliability Engineering Programs
Establish and track SLOs across your entire organization. Measure reliability improvements over time with data, not opinions.
🚀 Release Quality Gates
Use error budgets as deployment gates. Automatically block releases when budget is low and fast-track when budget is healthy.
🔔 On-Call Prioritization
Prioritize incidents based on error budget impact. Focus on-call attention on issues that actually threaten service reliability.
📊 Executive Reliability Reporting
Auto-generated reports showing reliability trends, budget consumption, and service health — ready for leadership reviews.
🤝 Customer SLA Management
Map internal SLOs to customer-facing SLAs. Track compliance and get early warning when SLAs are at risk.
🏗 Platform Team KPIs
Measure platform team effectiveness through service reliability metrics. Track improvements across the services you support.
One platform vs. a stack of tools
Replace the patchwork of monitoring, logging, tracing, and incident management tools with a single AI-powered platform
| Traditional Stack | ApexData | |
|---|---|---|
| SLO setup | Weeks of manual configuration per service | Auto-generated from real traffic patterns |
| Error budgets | Spreadsheets or custom tooling | Real-time tracking with burn-down visualization |
| Alert quality | Noisy threshold alerts | Burn rate alerts that catch real problems only |
| SLI coverage | Limited to metrics you instrument | Automatic SLIs from all traffic signals |
| Reporting | Manual report compilation | Automated weekly and monthly reports |
| Multi-team | Separate tools per team | Unified view across all teams and services |
| Accuracy | Based on estimated traffic patterns | Based on real traffic — always accurate |
| Maintenance | Constant tuning of thresholds | Self-adjusting as traffic patterns evolve |
Why engineers choose ApexData
🧠 Auto-Generated SLOs
No more guessing. SLOs are derived from actual traffic patterns and adjusted as your services evolve. Accuracy you can trust.
⚡ Burn Rate Intelligence
Multi-window burn rate alerting eliminates noise. Get alerted on real reliability problems, not transient blips.
🔒 Unified View
All SLOs across all teams in one place. From organization overview to individual service drill-down — complete reliability visibility.
✅ Actionable Budgets
Error budgets that connect to real decisions. Block risky deploys, prioritize on-call, and report to leadership — all from one platform.