Endpoint Performance Without SDK Overhead.
Captured at the kernel level
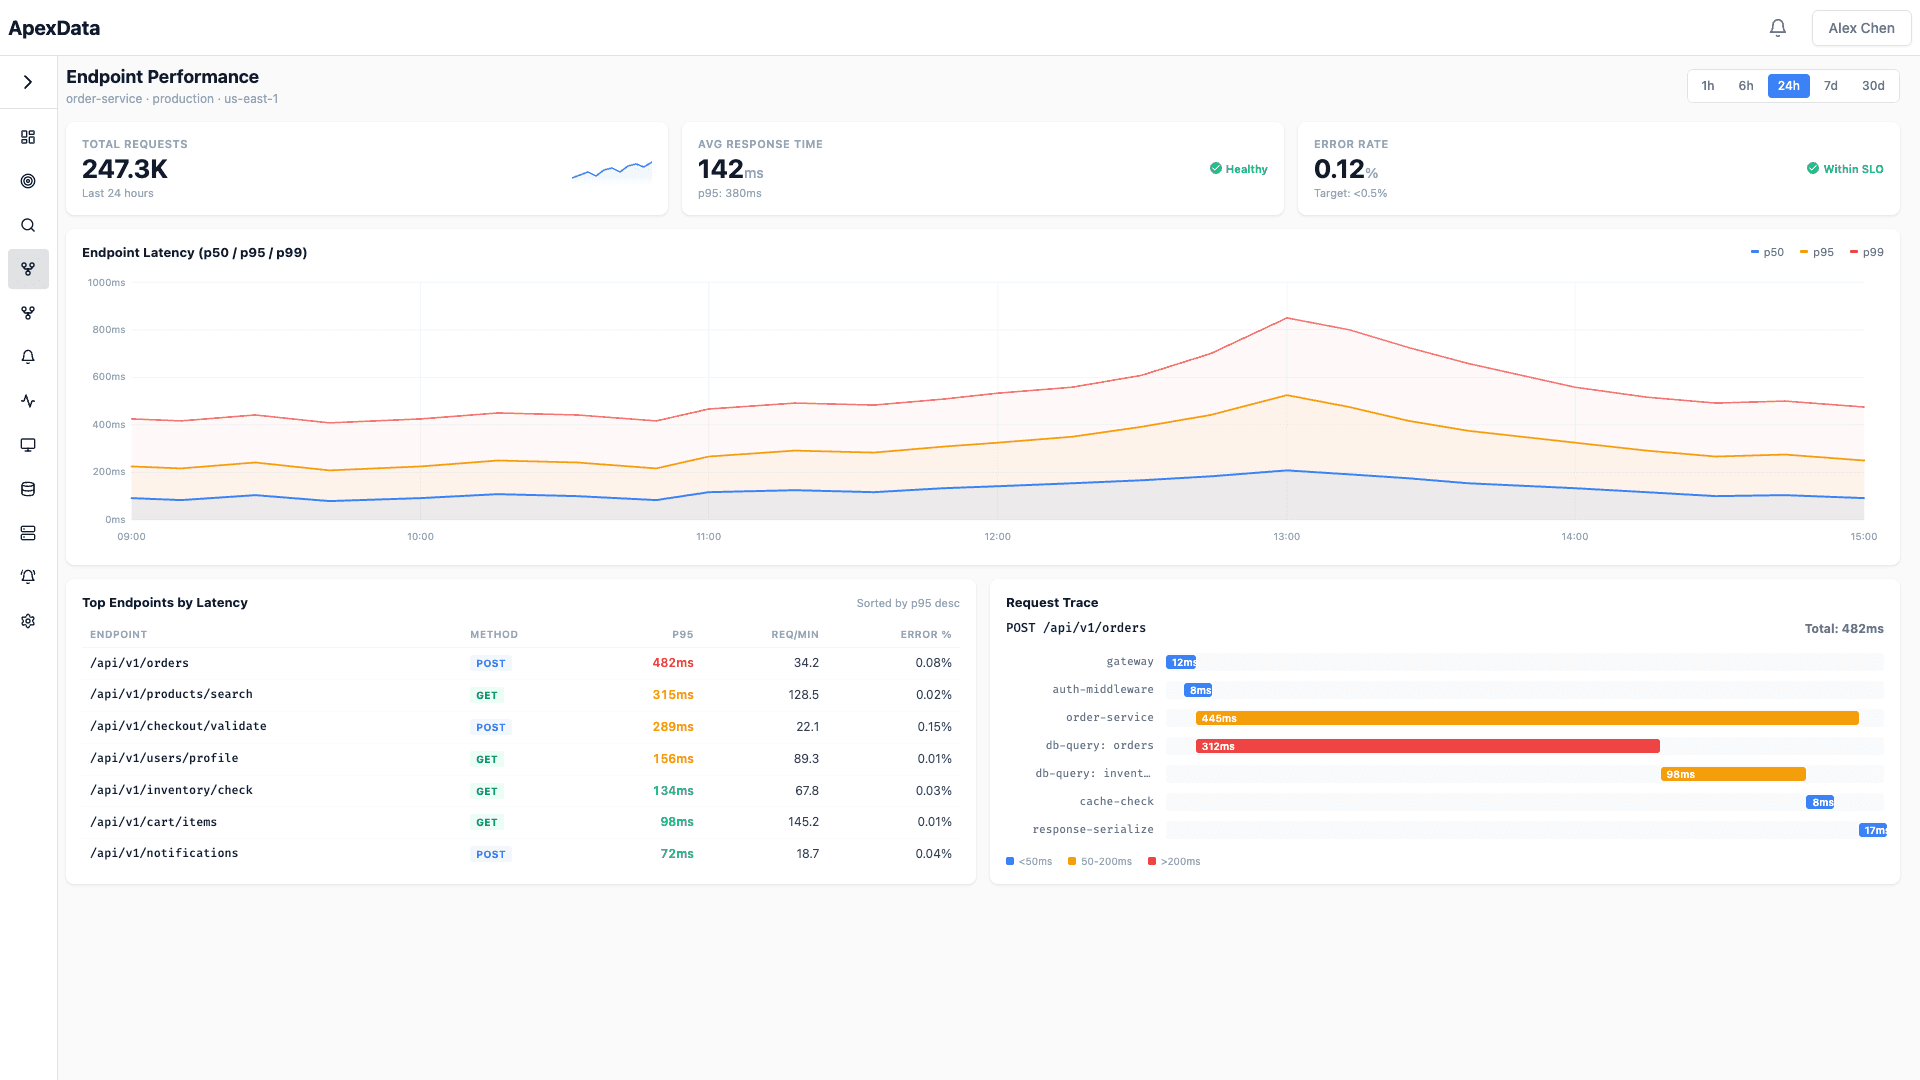
Automatic request tracing and latency breakdown for every endpoint — from API gateway to database and back. No SDKs, no agents, no instrumentation code
Full APM coverage.
Zero instrumentation overhead
From endpoint discovery to distributed traces — application performance monitoring that works from the kernel
🔍 Automatic Endpoint Discovery
Every HTTP and gRPC endpoint is discovered automatically from real traffic. No route registration or configuration needed — just deploy and get full endpoint visibility.
📊 Latency Breakdown
See p50, p95, and p99 latency for every endpoint. Break down response time into network, application processing, and database components to identify exactly where time is spent.
🔗 Distributed Trace Assembly
Traces are assembled automatically from eBPF-captured request data — no trace propagation headers or SDK required. See the complete request path through your infrastructure.
⚡ Error Classification
Errors are captured, classified, and grouped automatically. See error rates per endpoint, identify new error patterns, and track error resolution over time.
📈 Throughput Analytics
Track request volume across all endpoints in real time. Identify traffic patterns, peak usage periods, and capacity constraints before they become problems.
📋 Trace-to-Logs Correlation
Click from any trace span directly to the relevant log entries. No manual timestamp matching or log searching — instant context for every request.
Use ApexData for…
🚀 API Performance Optimization
Identify the slowest endpoints and break down exactly where time is spent. Optimize the endpoints that matter most to your users.
📋 Latency SLA Monitoring
Track endpoint latency against SLA targets in real time. Get alerted before latency breaches affect customers.
🔍 Microservice Debugging
Trace requests through your entire service mesh. See exactly where failures occur and which service is responsible.
📊 Release Performance Comparison
Compare endpoint performance across releases. Catch regressions immediately after deployment with automatic before/after analysis.
🔗 Third-Party Dependency Monitoring
Track latency and reliability of external API calls. Know when a third-party service is degrading before your users notice.
📈 Capacity Forecasting
Predict when endpoints will hit capacity limits based on traffic growth trends. Plan scaling proactively, not reactively.
One platform vs. a stack of tools
Replace the patchwork of monitoring, logging, tracing, and incident management tools with a single AI-powered platform
| Traditional Stack | ApexData | |
|---|---|---|
| Setup | Install SDKs in every service | Zero setup — eBPF captures requests automatically |
| Endpoint coverage | Only instrumented endpoints | Every endpoint discovered automatically |
| Trace collection | Requires trace propagation headers | Automatic trace assembly without headers |
| Latency detail | Total response time only | Full breakdown: network, app, database per request |
| Error tracking | Requires error reporting SDK | Automatic capture and classification via eBPF |
| Performance overhead | SDK CPU and memory per service | Near-zero overhead — runs in kernel space |
| New services | Manual SDK installation per deploy | Automatic — new services visible in seconds |
| Maintenance | SDK version management across services | Zero maintenance — we handle upgrades |
Why engineers choose ApexData
🧠 True Zero-Instrumentation
Not "low instrumentation." Zero. No SDKs, no agents, no sidecars, no code changes. eBPF captures everything at the kernel level.
⚡ Instant Visibility
Deploy ApexData and see every endpoint within minutes. No rollout process, no service-by-service onboarding. Complete APM coverage from day one.
🔒 No Performance Tax
eBPF runs in kernel space with near-zero overhead. Your application performance is never affected by monitoring overhead.
✅ Complete Picture
Endpoints, traces, errors, throughput, and latency — all in one platform. No tab-switching between separate APM, logging, and tracing tools.