AI Investigation

From Alert to Root
Cause in Minutes.
Down to the line of code

AI agents that investigate incidents across services, traces, and queries — correlating signals your team would take hours to connect

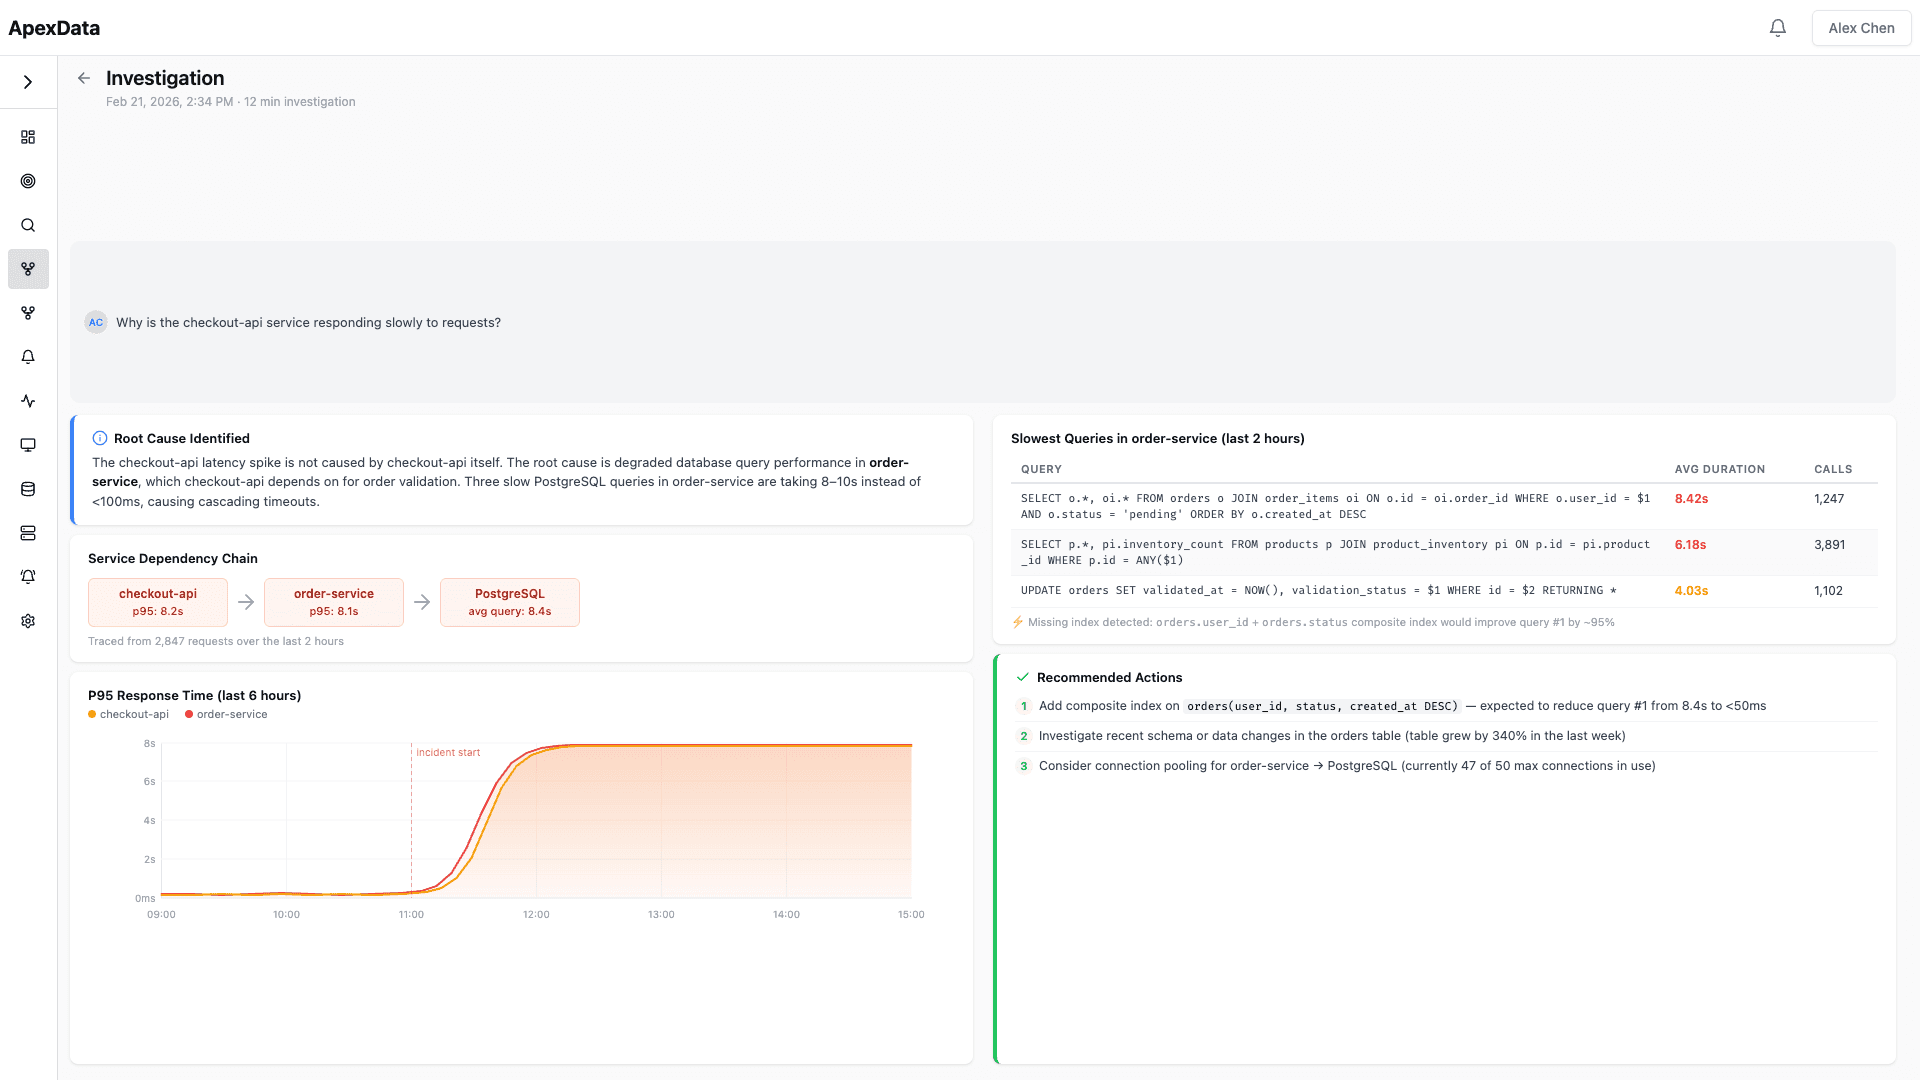
ApexData AI Investigation dashboard
<5 minTime to root cause
94%Root cause identification automatically
12+Signals correlated per incident
1000+SQL queries analyzed per second
Investigation Features

AI-powered root cause analysis.
Not just dashboards

From automated investigation to actionable recommendations — AI that traces through your full stack

Root Cause

// Automated Root Cause Analysis

  • Describe any problem in natural language. The AI agent builds the right queries, correlates logs, metrics, and traces, and traces the issue through your service mesh to the exact function and line of code.
  • Natural language queries — ask questions, get root causes
  • Traces to exact file and line of code
  • Automatic correlation across logs, metrics, and traces
  • Auto-generated investigation dashboards per incident
Correlation

// Cross-Service Correlation

  • Incidents rarely stay in one service. The AI agent follows the dependency chain, identifying which upstream or downstream service introduced the failure and when.
  • Follows dependency chains across services automatically
  • Identifies cascading failures and their origin
  • Correlates timing across distributed systems
  • Shows blast radius at each failure
Queries

// Query Performance Analysis

  • AI captures and analyzes every database query your services execute. Identifies slow queries, missing indexes, N+1 patterns, and connection pool issues without any code changes.
  • Zero SQL capture via eBPF
  • Missing index detection and recommendations
  • N+1 query pattern identification
  • Connection pool utilization analysis
Tracing

// Dependency Chain Tracing

  • See the complete path of a request through your infrastructure. From API gateway to database and back — with latency breakdown at every hop.
  • End-to-end request path visualization
  • Latency breakdown at every service hop
  • Identifies the slowest segment automatically
  • Links traces to specific code deployments
Actions

// Actionable Recommendations

  • Every investigation produces concrete next steps. Not just "the memory is slow" — specific index suggestions, configuration changes, and code references.
  • Specific fix recommendations with code references
  • Impact estimation for each recommendation
  • Priority-ranked action items
  • Exportable investigation reports
Memory

// Historical Pattern Matching

  • AI remembers past incidents and their resolutions. When a similar pattern occurs, it immediately surfaces the previous root cause and fix.
  • Matches current symptoms to past incidents
  • Surfaces previous resolutions automatically
  • Tracks recurring issues across deployments
  • Learns from your infrastructure patterns over time
Use cases

Use ApexData for...

Incident

Production Incident Response

From alert to root cause in minutes. AI investigates across all services simultaneously, correlates signals, and delivers a diagnosis — not just symptoms.

Performance

Performance Degradation Diagnosis

Trace slow performance through the entire service chain. Pinpoints whether the bottleneck is in code, queries, or infrastructure.

Database

Database Bottleneck Identification

AI analyzes query patterns, identifies missing indexes, and traces slow queries back to the exact ORM call that generates them.

Deploy

Deployment Regression Comparison

Automatically compares pre- and post-deploy metrics. Catch performance regressions before they impact all users.

SLA

SLA Breach Investigation

When SLAs are breached, get a complete investigation report with root cause, timeline, and remediation steps.

Scaling

AI Capacity-Related Slowdowns

Distinguishes between code issues and capacity limits. AI identifies when scaling, not re-deploying, is the right response.

Compare & Learn

One platform
vs. a stack
of tools

Replace the patchwork of monitoring, logging, tracing, and incident management tools with a single AI-powered platform.

  • No more tab-switching
  • No stale diagrams
  • No manual investigation
Traditional StackApexData
Investigation

Manual correlation across 4–5 tools

You open Datadog, Splunk, Jaeger, and a wiki tab, then try to line up timestamps by hand while the incident is still live.

Investigation

AI traces through full stack automatically

One query kicks off a full trace across every service, log line, and metric — no tab-switching, no manual timestamp matching.

Root cause depth

"The pod crashed" or "Memory spike"

Traditional dashboards give you a symptom, not a cause. You're left guessing why memory spiked or what actually crashed the pod.

Root cause depthdb.go:247

connection pool exhausted at maxOpenConns=10

ApexData points to the exact line, the exact config value, and the exact moment things went wrong — no guesswork required.

Time to resolve

Hours of manual investigation

Every incident turns into a scavenger hunt through logs, metrics, and traces while your team scrambles to piece together what happened.

Time to resolve

Minutes with AI-driven analysis

AI correlates every signal simultaneously and hands you a diagnosis, not a pile of dashboards to stare at.

Query analysis

Requires separate APM tool or manual profiling

To see what your queries are actually doing, you need to bolt on another tool — or profile things by hand and hope you catch the slow one.

Query analysis

Automatic SQL capture and analysis via eBPF

Every query is captured at the kernel level automatically. Slow queries, missing indexes, and connection issues surface without any setup.

Cross-service

Tab-switching between service dashboards

Following a request across five microservices means five separate dashboards, five separate mental models, and a lot of lost time.

Cross-service

Follows dependency chains automatically

ApexData walks the entire call chain for you — service to service, hop to hop — so you see the whole picture in one place.

Historical context

Relies on team memory and past tickets

"Didn't this happen before?" Yes — but finding that old ticket, or the one person who remembers, takes half the incident.

Historical context

Pattern matching against previous incidents

ApexData automatically flags similar past incidents and what fixed them, so your team isn't solving the same problem twice.

Recommendations

Generic "check the logs" advice

Most tools tell you where to look, not what to do. You still have to figure out the fix yourself.

Recommendations

Specific index suggestions, config changes, code refs

You get concrete next steps — add this index, change this config, look at this line of code — not vague suggestions.

Reports

Written manually from memory

Post-mortems get written days later from fuzzy memory, missing details, and Slack screenshots pieced together at the last minute.

Reports

Auto-generated with root cause, timeline, and remediation

A full report — root cause, timeline, and remediation steps — is generated automatically the moment the incident is resolved.

Stop maintaining diagrams.
Start seeing reality.

  • Zero config
  • Real-time
  • Every service, automatically
  • Up in under 1 hour
Book a Demo
Why ApexData

Why engineers choose ApexData

01

AI-Native Investigation

Not a bolt-on AI feature. The entire product is built around AI investigation — it understands your infrastructure and traces through your entire stack automatically.

02

Zero Instrumentation

eBPF-based collection. No code changes, no SDK installation, no instrumentation debt. Connect your cluster and we pull everything.

03

Your Infrastructure

Deploy on your cluster, on your VPC. Your data never leaves your infrastructure. SOC 2 Type II compliant.

04

Production Ready

Battle-tested on production workloads from startups to enterprise — reliable observability at any scale.

Contact

Get started.
See your systems clearly.
Ship faster

By clicking "Send Message" you agree to our Privacy Policy