Database Insights

Profile Every Query Without
Changing Code.
Captured at the kernel level

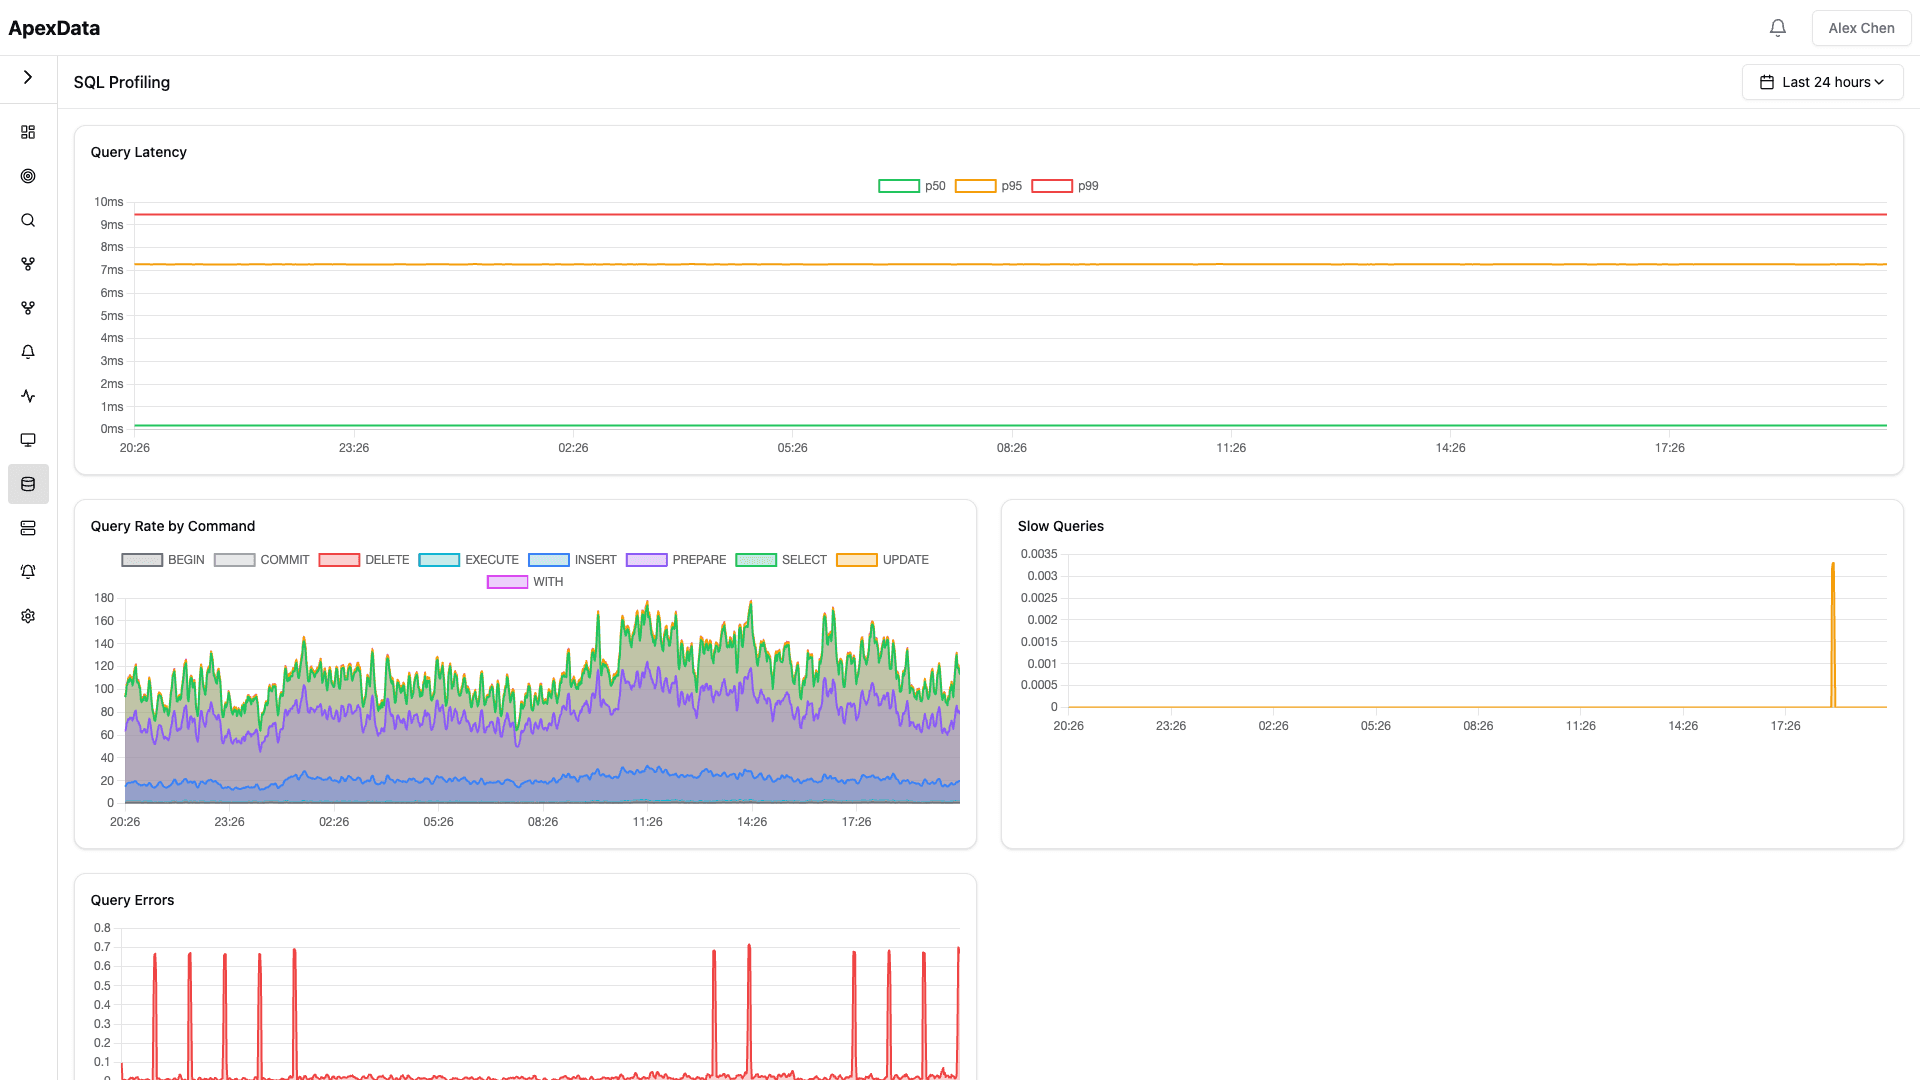
Automatic SQL capture and analysis via eBPF — see exactly which queries slow down your services, identify missing indexes, and detect N+1 patterns

ApexData Database Insights dashboard
50K+Queries captured per hour
100%Slow queries identified
40%Avg performance improvement
0 codeChanges required
Investigation Features

See inside your database.
Without touching your code

From automatic SQL capture to query plan analysis — deep database visibility from eBPF

Capture

// Automatic SQL Capture

  • Every database query your services execute is captured automatically at the kernel level via eBPF. No agents, no proxies, no code modifications.
  • Captures all SQL queries via eBPF — zero code changes
  • Supports PostgreSQL, MySQL, and MongoDB
  • Records query parameters, timing, and calling service
  • No performance overhead on your application
Profiling

// Query Performance Profiling

  • See p50, p95, and p99 latency for every query. Identify which queries are responsible for the most total database time and where optimization will have the biggest impact.
  • Latency percentiles for every query
  • Total time ranking — find biggest time-consumers
  • Query frequency and execution patterns
  • Historical trends to catch regressions
N+1

// N+1 Query Detection

  • Automatically identifies N+1 query patterns by correlating request paths with query executions. See exactly which API endpoints generate excessive database calls.
  • Detects N+1 patterns from request to query correlation
  • Shows the exact ORM call approaching connection limits
  • Shows query count per request with examples
  • Estimated performance improvement from fixing each pattern
Connections

// Connection Pool Monitoring

  • Track connection pool utilization across all services. Detect pools approaching connection limits, and right-size your connection limits.
  • Real-time pool utilization per service
  • Alerts when approaching connection limits
  • Identifies services with inefficient pool usage
  • Recommendations for optimal pool sizing
Plans

// Query Plan Analysis

  • Understand why queries are slow. See execution plans, identify missing indexes, and get specific recommendations for schema improvements.
  • Automatic execution plan capture for slow queries
  • Missing index detection with CREATE INDEX suggestions
  • Table scan identification and remediation
  • Index usage statistics and redundancy detection
Trends

// Historical Query Trends

  • Track query performance over time. Detect gradual degradation, correlate regressions with deployments, and validate that optimizations actually worked.
  • Query latency trends over days, weeks, and months
  • Deployment markers to correlate changes
  • Regression alerts when queries slow down
  • Before/after comparison for optimizations
Use cases

Use ApexData for...

ORM

Optimizing ORM-Generated Queries

See the actual SQL your ORM generates and how it performs. Identify where eager loading, query batching, or raw SQL would improve performance.

N+1

Identifying N+1 Patterns

Automatically detect N+1 patterns across your entire application. See which endpoints generate hundreds of queries per request.

Pool

Connection Pool Tuning

See live connection pool utilization based on actual usage data. Stop guessing and start configuring pools based on real traffic patterns.

Migration

Migration Performance Validation

Compare query performance before and after schema migrations. Historical data actually improves the queries they target.

Timeout

Debugging Timeout Errors

Trace timeout errors to the specific slow queries that cause them. See the full chain from HTTP request to database query.

Capacity

Capacity Planning for Databases

Understand query growth trends and predict when you will need to scale your database. Plan upgrades based on data, not guesswork.

Compare & Learn

One platform
vs. a stack
of tools

Replace the patchwork of monitoring, logging, tracing, and incident management tools with a single AI-powered platform.

  • No more tab-switching
  • No stale diagrams
  • No manual investigation
Traditional StackApexData
Setup

Install agents on every service

Every new service means another agent to install, configure, and keep updated. Miss one, and it's a blind spot until something breaks.

Setup

Zero setup — eBPF captures queries automatically

Attach at the kernel level once, and every service — new or old — is covered instantly. No agents, no per-service config.

Query capture

Requires code changes or proxy

To see actual query traffic, you're wrapping database calls, adding middleware, or routing through a proxy — and hoping nothing breaks.

Query capture

Kernel-level capture with no code modifications

Queries are captured as they hit the wire — no proxy, no wrapper, no touching a single line of application code.

N+1 detection

Manual code review or profiling

N+1 queries slip through code review constantly. You usually find them the hard way — during a slow page load in production.

N+1 detection

Automatic detection across all endpoints

Every endpoint is watched continuously. The moment a pattern looks like N+1, you're flagged — before users notice the slowdown.

Connection pools

Manual monitoring scripts

Someone wrote a script two years ago to check pool usage. It's brittle, nobody trusts it fully, and it doesn't tell you what size to use instead.

Connection pools

Real-time tracking with right-sizing recommendations

Pool usage is tracked live, and ApexData tells you exactly how to size it based on real traffic — not guesswork.

Missing indexes

Run EXPLAIN manually on suspected queries

You only check for missing indexes once a query is already slow — and only if someone thinks to run EXPLAIN on it in the first place.

Missing indexes

Auto-detected with CREATE INDEX suggestions

Every query is analyzed automatically, and when an index would help, you get the exact CREATE INDEX statement to run.

Historical data

Point-in-time snapshots at best

Most monitoring gives you a snapshot of right now. Figuring out when a query got slow — or what deploy caused it — is guesswork.

Historical data

Continuous trends with deployment correlation

Query performance is tracked over time and automatically lined up against deploys, so you can pinpoint exactly what changed.

Coverage

Only instrumented services

If a service wasn't set up with the right library or agent, it's invisible — including the shadow services nobody remembers exist.

Coverage

Every service that talks to a database

eBPF sees traffic at the kernel level, so any service touching a database is covered automatically — instrumented or not.

Overhead

Agent CPU and memory on every pod

Every agent you run is competing for CPU and memory with your actual application — a tax you pay on every single pod, all the time.

Overhead

Near-zero overhead — runs in kernel space

Running in kernel space means monitoring costs almost nothing — no competing for resources, no performance tax on your services.

Stop maintaining diagrams.
Start seeing reality.

  • Zero config
  • Real-time
  • Every service, automatically
  • Up in under 1 hour
Book a Demo
Why ApexData

Why engineers choose ApexData

01

Kernel-Level Visibility

eBPF captures queries at the kernel level — before and after execution, no proxies, no code changes. See every query from every service.

02

Automatic Analysis

Our AI automatically detects N+1 patterns, identifies missing indexes, and recommends specific optimizations — no manual profiling needed.

03

Zero Application Impact

No SDK, no agent, no sidecar proxy. No code changes required. Zero performance overhead on your application. Works on every service.

04

Actionable Results

Every finding includes specific recommendations — CREATE INDEX statements, query rewrites, connection pool sizing based on actual traffic data.

Contact

Get started.
See your systems clearly.
Ship faster

By clicking "Send Message" you agree to our Privacy Policy