Topology Features

See Every Service Connection Instantly.
No config files. No annotations.

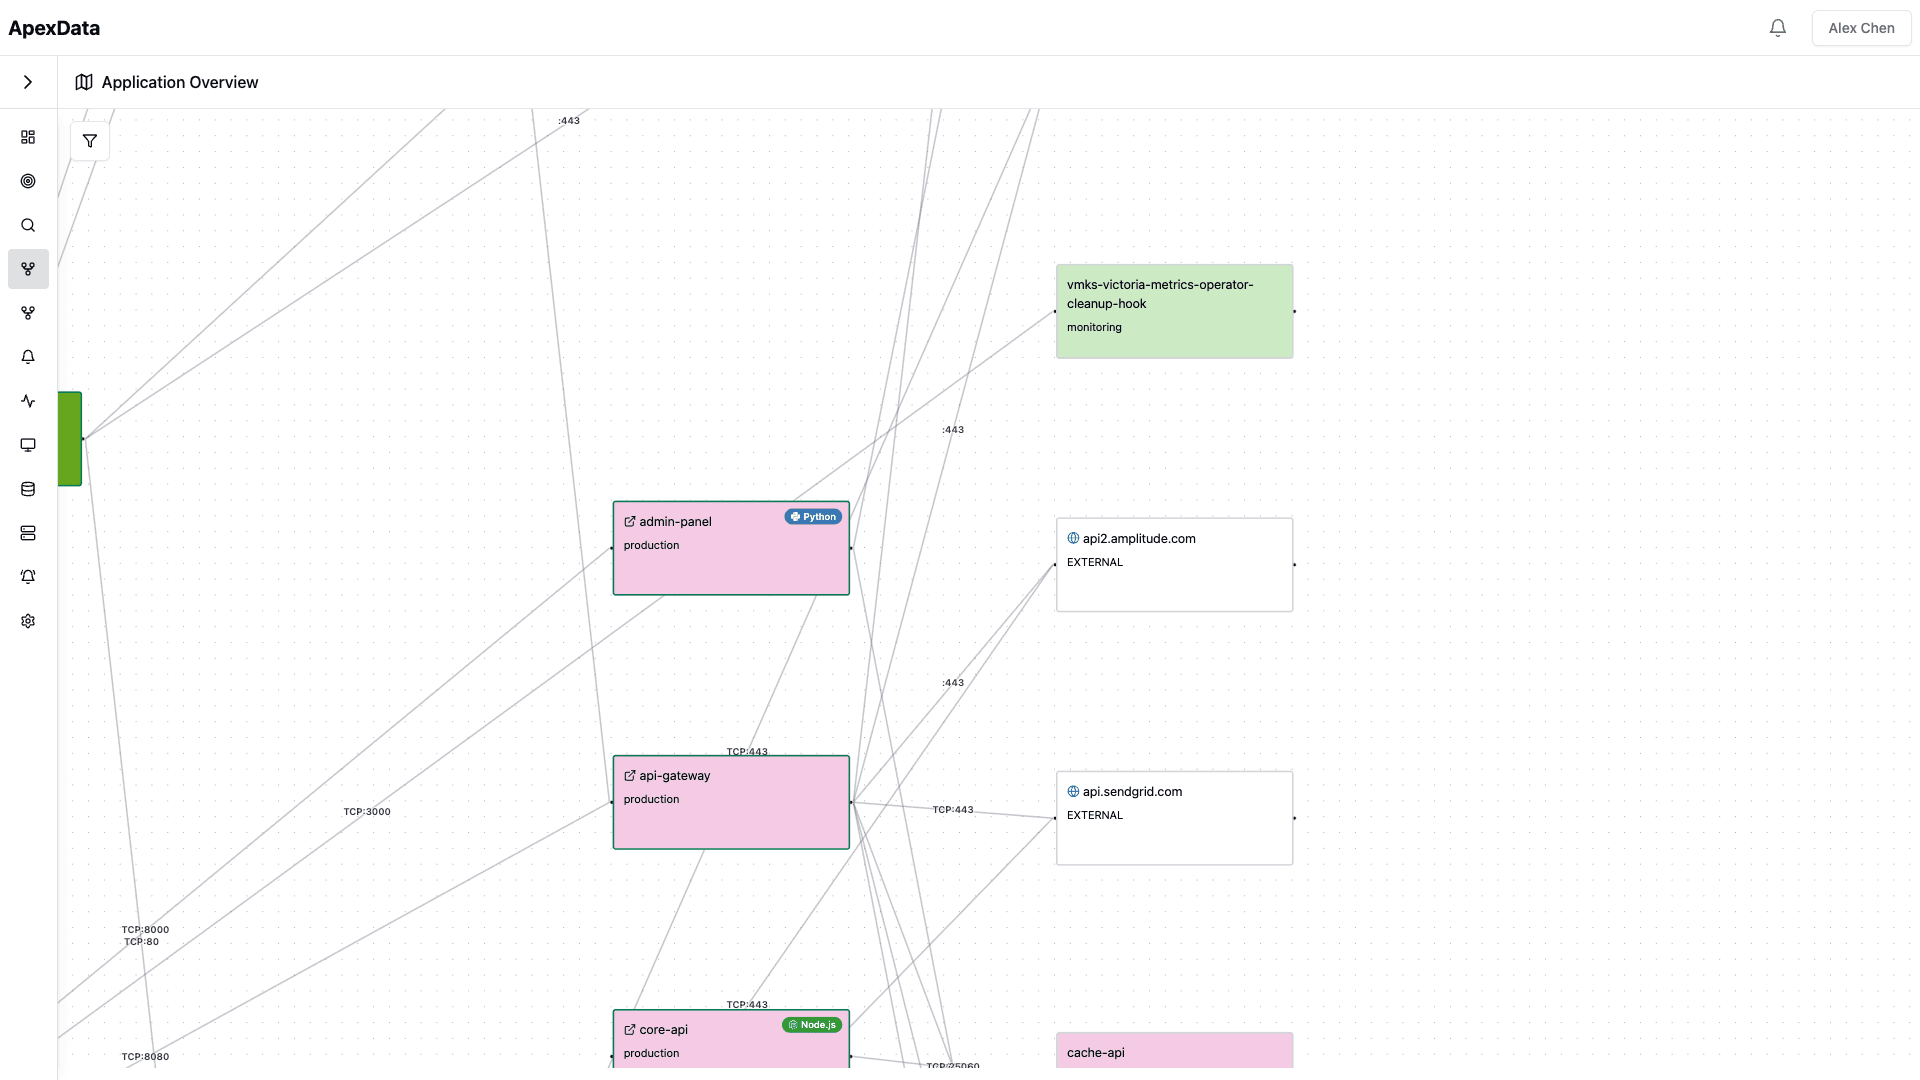
ApexData uses eBPF to build a real-time dependency map of your entire cluster — automatically discovering services, connections, and traffic flows.

ApexData Application Map
100%Services mapped automatically
1000+Connections discovered
Real‑timeDependencies visualized
0 configSetup time
Topology Features

Real-time service topology.
Not stale diagrams

A continuously updated map of how your services communicate — a living map of your infrastructure

Discovery

// Auto-Discovery

  • Every service, pod, and external dependency is discovered automatically from real network traffic. No manual registration or service catalogs to maintain.
  • Discovers services within seconds of deployment
  • Detects external dependencies and third-party APIs
  • Works across namespaces and clusters
  • No service catalog maintenance required
Topology

// Real-Time Topology

  • A continuously updated map of how your services communicate. See the actual topology, not what someone documented six months ago.
  • Updated in real time from live traffic
  • Shows direction and volume of communication
  • Clusters services by namespace or label
  • Highlights orphaned or unused services
Traffic

// Traffic Flow Visualization

  • See request volume, latency, and error rates on every connection edge. Identify bottlenecks and understand traffic patterns at a glance.
  • Request rate and latency on every edge
  • Error rate highlighting on connections
  • Traffic volume proportional to edge thickness
  • Historical playback of traffic patterns
Anomalies

// Anomaly Detection on Edges

  • AI monitors every service connection for unusual patterns — latency spikes, error rate increases, or unexpected traffic shifts.
  • Automatic baseline learning per connection
  • Alerts on latency or error rate anomalies
  • Detects new or removed service connections
  • Reduces noise by correlating related anomalies
Scale

// Namespace & Cluster Views

  • Zoom from cluster-wide overview to individual namespace or drill into a single service and its direct dependencies.
  • Multi-cluster topology in a single view
  • Namespace-level grouping and filtering
  • Single-service dependency drill-down
  • Filter by labels, annotations, or traffic patterns
Endpoints

// API Endpoint Mapping

  • Go beyond service-level topology. See which specific API endpoints each service calls, with per-endpoint latency and error rates.
  • Per-endpoint traffic breakdown
  • Identifies slow or failing API routes
  • Maps internal and external API dependencies
  • Links endpoints to distributed traces
Use cases

Use ApexData for...

Onboarding

New Engineer Onboarding

Give new engineers an interactive map of the entire architecture. No more reading outdated wiki pages or asking five people how services connect.

Migration

Migration Planning

Identify all consumers of a service before migrating. See the real dependency chain, not what was documented when the service was built.

Incident

Incident Scoping

Instantly see the blast radius of a failing service. Trace upstream and downstream dependencies to understand cascading impact.

Capacity

Capacity Planning

Understand traffic patterns between services. Identify bottlenecks and where scaling will have the most impact.

Compliance

Compliance Auditing

Verify that services communicate only through approved paths. Detect unauthorized connections or unexpected external dependencies.

Architecture

Architecture Reviews

Use the live topology as the basis for architecture discussions. Compare actual behavior to intended design.

Compare & Learn

One platform
vs. a stack
of tools

Your team spends hours every week stitching together Datadog, Splunk, Jaeger, and a Confluence wiki that's 6 months out of date. ApexData replaces all of it — and actually shows you what's broken.

  • No more tab-switching
  • No stale diagrams
  • No manual investigation
Traditional StackApexData
Setup

Weeks of manual work

Someone draws diagrams in Miro. Someone else annotates services. Six months later it's wrong and nobody updates it.

Setup

Auto-discovered in minutes

Connect your cluster. Every service, dependency, and traffic flow appears automatically — from real network data, not documentation.

Incident Investigation

Open 8 tabs, start guessing

Datadog for metrics, Splunk for logs, Jaeger for traces. You manually cross-reference timestamps. The incident is still live while you're searching.

Incident Investigation

Root cause in <5 minutes

AI correlates logs, metrics, and traces across all services simultaneously. You get a diagnosis — not a dashboard to stare at.

Coverage

Only what you know about

Shadow services, undocumented dependencies, and third-party calls are invisible. You find out they exist when they break.

Coverage

Every service, including shadows

eBPF captures all traffic at the kernel level. Nothing is invisible — not even the services your team forgot existed.

Onboarding

Read docs, hope they're current

New engineers spend their first week reading outdated wikis and asking five people how services connect. Expensive, slow, and demoralizing.

Onboarding

Interactive live architecture map

New engineers explore the actual, live topology on day one. Click any service to see what it talks to, what calls it, and how it's performing right now.

Maintenance

A full-time job keeping it current

Someone on your team is responsible for keeping diagrams updated. Every deploy, every new service, every refactor — manual work that never ends.

Maintenance

Zero maintenance, ever

The topology updates itself from live traffic. Deploy a new service — it appears. Remove one — it disappears. No human intervention required.

Stop maintaining diagrams.
Start seeing reality.

  • Zero config
  • Real-time
  • Every service, automatically
  • Up in under 1 hour
Book a Demo
Why ApexData

Why engineers choose ApexData

01

Always Current

Unlike manually maintained diagrams, the application map updates continuously from actual network traffic. Your topology can never go stale.

02

Zero Configuration

eBPF-based discovery means no annotations, no service mesh required. Deploy and your topology appears immediately.

03

Deep Visibility

Goes beyond service names. See endpoint-level connection latency, error rates, and traffic volume on every edge.

04

Multi-Cluster Ready

Works across multiple clusters and namespaces. See your entire infrastructure in a single, interactive topology view.

Contact

Get started.
See your systems clearly.
Ship faster

By clicking "Send Message" you agree to our Privacy Policy