
APM

Endpoint Performance Without
SDK Overhead.
Captured at the kernel level

Automatic request tracing and latency breakdown for every endpoint —
from API gateway to database and back. No SDKs, no agents,
no instrumentation code

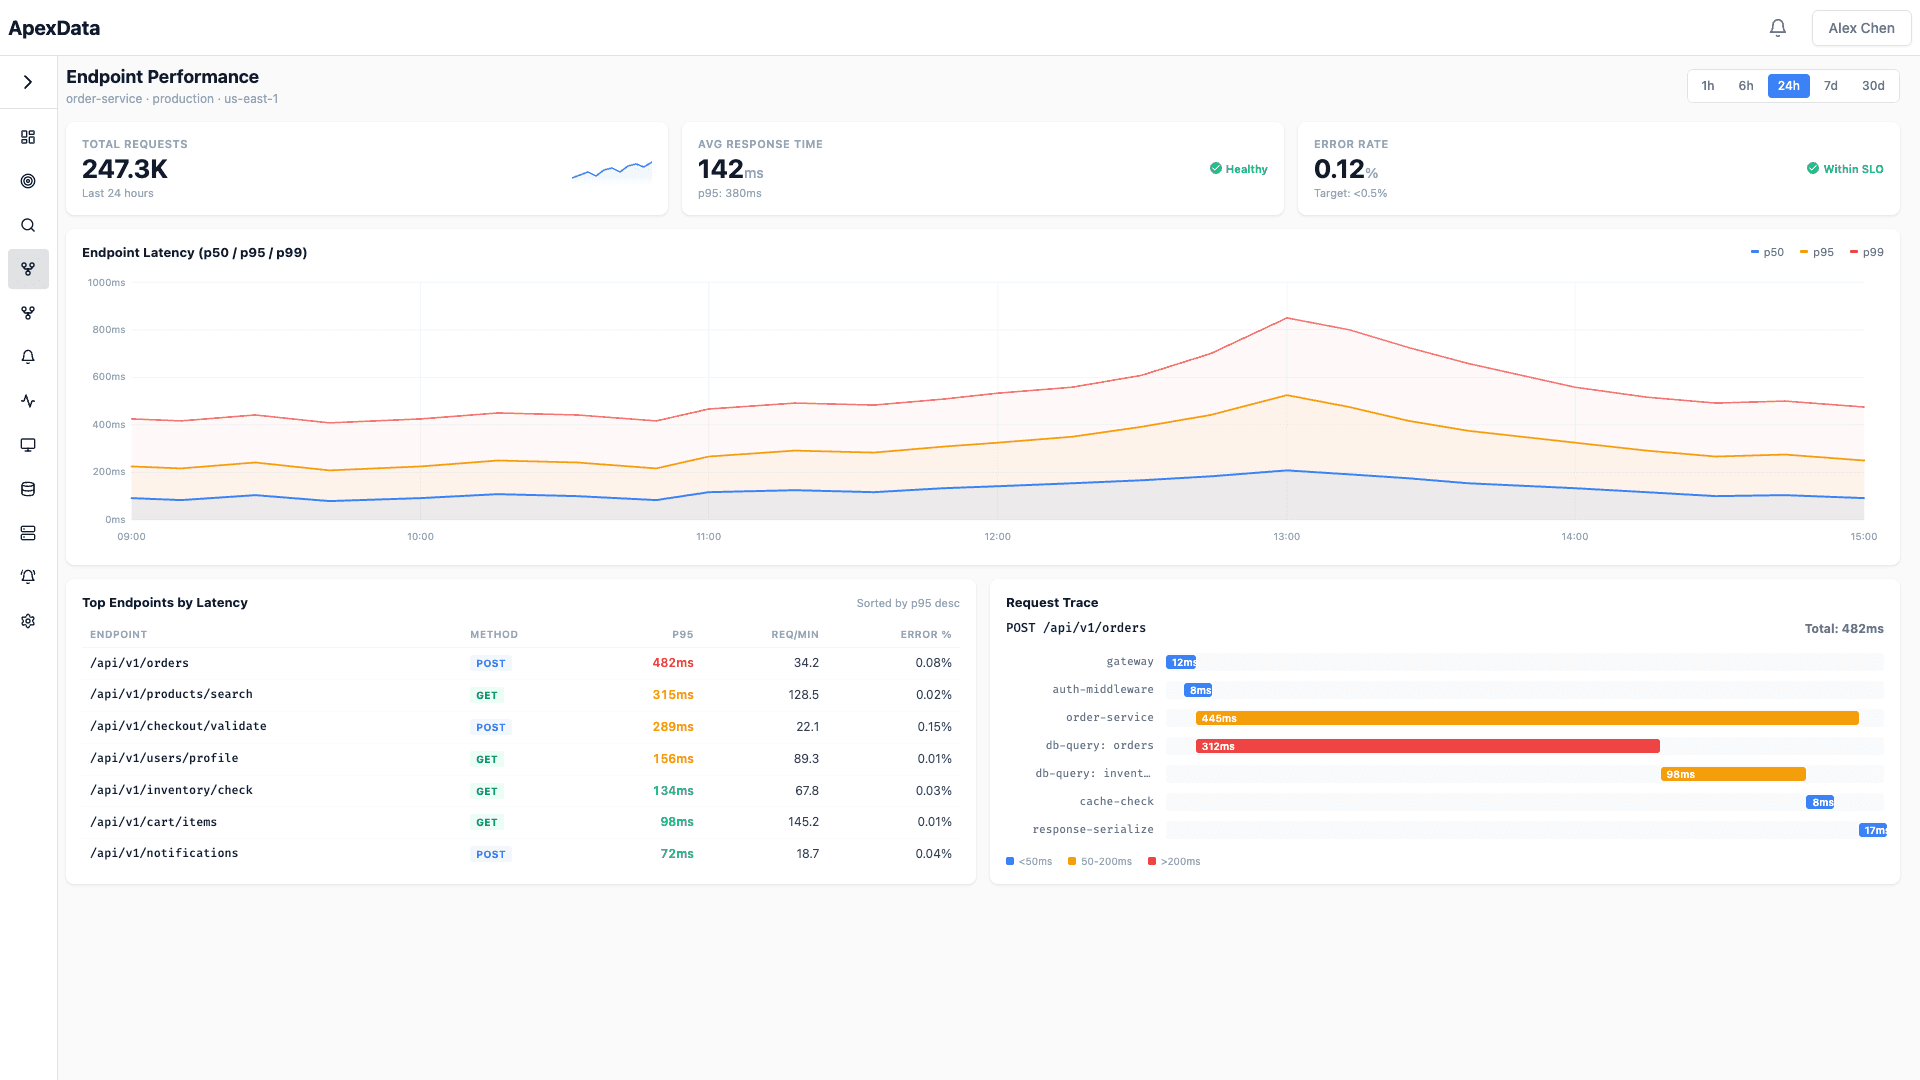
ApexData APM dashboard
1000+Endpoints discovered automatically
p50/p95/p99Latency percentiles per endpoint
10K+Traces captured per second
0 SDKNo instrumentation required
APM Features

Full APM coverage.
Zero instrumentation overhead

Distributed traces + application performance monitoring that works
from the kernel

Discovery

// Automatic Endpoint Discovery

  • Traces are discovered automatically from real traffic. No route registration or configuration needed — just deploy and get full endpoint visibility.
  • Discovers all HTTP and gRPC endpoints automatically
  • Groups by service and route pattern
  • Detects new endpoints within seconds of first request
  • No route registration or configuration required
Latency

// Latency Breakdown

  • For each endpoint, break down response time into network, application processing, and database components — see exactly where time is spent.
  • p50, p95, and p99 percentiles for every endpoint
  • Time breakdown: network, application, database
  • Historical latency trends with deployment markers
  • Comparison across service versions
Traces

// Distributed Trace Assembly

  • Traces are assembled automatically from eBPF-captured request data — no trace propagation headers or SDK required. See the complete request path through your infrastructure.
  • Automatic trace assembly without SDK headers
  • End-to-end request path visualization
  • Latency at every hop in the chain
  • Links to logs and metrics at each service
Errors

// Error Classification

  • Errors are automatically classified and grouped. See error rates per endpoint, identify new error patterns, and track error resolution over time.
  • Automatic error grouping by type and pattern
  • Error rate tracking per endpoint
  • New error pattern detection after deployments
  • Error resolution tracking over time
Throughput

// Throughput Analytics

  • Track request volume per endpoint in real time. Identify traffic patterns and load imbalances, and spot capacity constraints before they become problems.
  • Real-time request volume per endpoint
  • Traffic pattern analysis and load detection
  • Load forecasting based on growth trends
  • Alerts on unexpected traffic changes
Logs

// Trace-to-Log Correlation

  • Click from any trace span directly to the relevant log entries. No manual timestamp matching or log searching — instant context for every problem.
  • One-click from trace span to related logs
  • Automatic timestamp and request correlation
  • Filtering log scope to the exact request
  • Links to metrics dashboards for the same timeframe
Use cases

Use ApexData for...

Performance

API Performance Optimization

Identify the slowest endpoints and break down exactly where the latency is. Optimize the endpoints that matter most to your users.

SLA

Latency SLA Monitoring

Track endpoint latency against SLA targets in real time. Get alerted before latency SLA breaches affect customers.

Microservices

Microservice Debugging

Trace requests through your entire service mesh. See exactly where a third-party service is degrading and which service is responsible.

Release

Release Performance Comparison

Compare endpoint performance across releases. Catch regressions immediately after deployment with automatic before/after comparison.

Third-Party

Third-Party Dependency Monitoring

Track the quality and stability of external API calls. Know when a third-party service is degrading before your users notice.

Capacity

Capacity Forecasting

Predict when endpoints will hit capacity limits based on traffic growth trends. Plan scaling proactively, not reactively.

Compare & Learn

One platform
vs. a stack
of tools

Replace the patchwork of monitoring, logging, tracing, and incident management tools with a single AI-powered platform.

  • No more tab-switching
  • No stale diagrams
  • No manual investigation
Traditional StackApexData
Setup

Install SDKs in every service

Every service needs its own SDK pulled in, configured, and kept up to date — a checklist item for every new service your team ships.

Setup

Zero setup — eBPF captures requests automatically

Attach at the kernel level once, and every request across every service is captured instantly — no SDKs, no per-service setup.

Endpoint coverage

Only instrumented endpoints

If an endpoint wasn't wired up with the SDK, it simply doesn't show up in traces — including the ones nobody remembers adding.

Endpoint coverage

Every endpoint discovered automatically

eBPF sees every request at the kernel level, so endpoints are discovered and traced automatically — instrumented or not.

Trace collection

Requires trace propagation headers

Traces break the moment a header isn't passed correctly between services — one missed middleware and your trace goes dark.

Trace collection

Automatic trace assembly without headers

Traces are reconstructed directly from observed traffic — no headers to propagate, no middleware to configure correctly.

Latency detail

Total response time only

You see how long a request took overall, but not where the time actually went — network, app logic, or the database.

Latency detail

Full breakdown: network, app, database per request

Every request is broken down by phase, so you know exactly whether the slowdown is in the network hop, app logic, or the database call.

Error tracking

Requires error reporting SDK

Without a separate error reporting SDK wired into every service, errors slip by silently until someone notices the symptoms downstream.

Error tracking

Automatic capture and classification via eBPF

Errors are captured and classified automatically as they happen — no SDK to install, no error reporting pipeline to maintain.

Performance overhead

SDK CPU and memory per service

Every SDK you run adds its own CPU and memory tax on top of your application — a cost that adds up across every service and every pod.

Performance overhead

Near-zero overhead — runs in kernel space

Running in kernel space means tracing costs almost nothing — no SDK competing for resources, no measurable tax on your services.

New services

Manual SDK installation per deploy

Every new service or deploy means remembering to add the SDK — skip it once, and that service is invisible until someone notices.

New services

Automatic — new services visible in seconds

The moment a new service starts sending traffic, it's visible — no install step, no deploy checklist item to remember.

Maintenance

SDK version management across services

Keeping SDK versions in sync across dozens of services is its own ongoing project — with breaking changes to track and upgrades to schedule.

Maintenance

Zero maintenance — we handle upgrades

There's no SDK version to track or upgrade — ApexData handles everything on our end, so your team never touches it again.

Stop maintaining diagrams.
Start seeing reality.

  • Zero config
  • Real-time
  • Every service, automatically
  • Up in under 1 hour
Book a Demo
Why ApexData

Why engineers choose ApexData

01

True Zero-Instrumentation

Not "low instrumentation." Zero. No SDKs, no agents, no sidecars, no code changes. eBPF captures everything at the kernel level — complete APM coverage from day one.

02

Instant Visibility

Deploy ApexData and see every endpoint within minutes. No rollout plan, no configuration needed. Complete APM coverage from day one.

03

No Performance Tax

eBPF runs in kernel space — no CPU or memory overhead on your application pods. Application performance is completely unaffected.

04

Complete Picture

Endpoints, traces, errors, throughput, and latency — all in one place. Stop switching between APM, logging, and tracing tools.

Contact

Get started.
See your systems clearly.
Ship faster

By clicking "Send Message" you agree to our Privacy Policy