Service Health

SLOs That Configure
Themselves.
Error budgets that
actually work

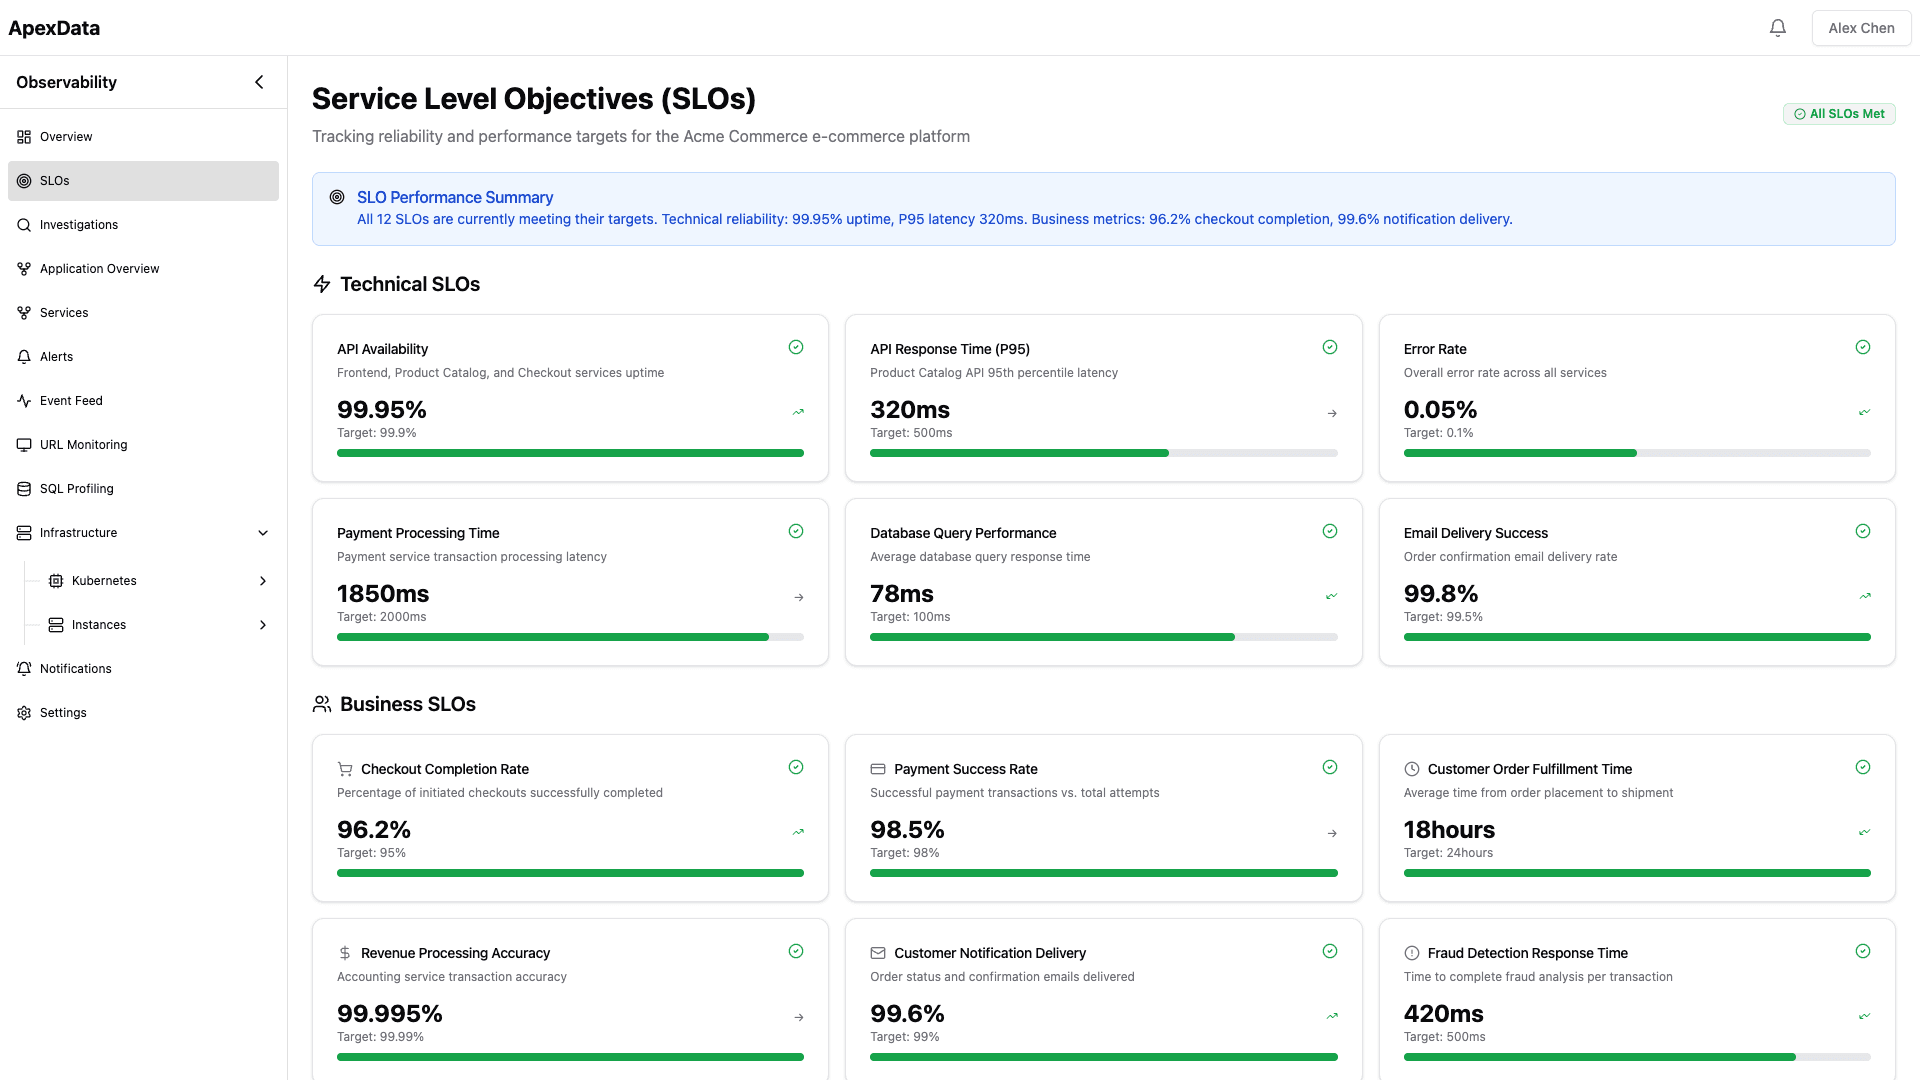
Automatic SLO tracking based on real traffic patterns. Know exactly when your error budget is at risk — without configuring a single threshold.

ApexData Service Health dashboard with SLO map
100%SLOs auto-generated from traffic
99.5%Error budget accuracy
80%Faster error budget creation
<30sTime to detect SLO violations
SLO Features

Reliability you can measure.
Not just monitor

From auto-generated SLOs to burn-rate alerts — manage service health with data, not guesswork

Auto SLOs

// Auto-Generated SLOs

  • ApexData analyzes your actual traffic patterns and generates appropriate SLOs automatically. No more guessing what "four nines" means for each service.
  • SLOs generated from real traffic baselines
  • Appropriate targets per service based on actual behavior
  • Covers availability, latency, and error rate
  • Adjusts recommendations as traffic patterns evolve
Budgets

// Error Budget Tracking

  • Real-time error budget consumption with clear burn-down visualization. See exactly how much budget remains and when you need to slow down releases.
  • Real-time budget consumption tracking
  • Burn-down charts with projected exhaustion dates
  • Per-service and per-team budget views
  • Historical budget trends over release cycles
Burn Rate

// Burn Rate Alerts

  • Multi-window burn-rate alerting that catches real problems while ignoring noise. Get alerted when error budget consumption accelerates — not on every minor blip.
  • Multi-window burn rate detection
  • Threshold-based and trend-based alerts
  • Severity based on budget impact, not arbitrary thresholds
  • Integrates with PagerDuty, Slack, and Opsgenie
Signals

// Multi-Signal SLIs

  • Build SLIs from multiple signal types — HTTP status codes, latency percentiles, gRPC error rates, and custom metrics. Combine signals for a complete picture of service health.
  • Combines HTTP, gRPC, and custom metrics
  • Latency-based SLIs with configurable percentiles
  • Availability SLIs from real user traffic
  • Custom SLI definitions when needed
Dashboard

// SLO Dashboards

  • Purpose-built dashboards for SLO management. At-a-glance service health across your entire organization, with drill-down into individual SLOs.
  • Organization-wide SLO overview
  • Per-team and per-service views
  • Drill down from overview to individual SLO details
  • Filterable by status, team, or criticality
Reports

// Reporting & Trends

  • Weekly and monthly reliability reports generated automatically. Track reliability improvements over time and share progress with leadership.
  • Automated weekly/monthly reliability reports
  • Trend analysis across release cycles
  • Team-level reliability scorecards
  • Exportable reports for leadership reviews
Use cases

Use ApexData for...

Reliability

Reliability Engineering Programs

Establish and track SLOs across your entire organization. Measure reliability improvements over time with data, not opinions.

Release

Release Quality Gates

Use error budgets as deployment gates. Automatically block releases when budget is low and fast-track when budget is healthy.

On-Call

On-Call Prioritization

Prioritize incidents based on error budget impact. Focus on-call attention on issues that actually threaten service reliability.

Executive

Executive Reliability Reporting

Auto-generated reports showing reliability trends, budget consumption, and service health — ready for leadership reviews.

Customer

Customer SLA Management

Map internal SLOs to customer-facing SLAs. Track compliance and get early warning when SLAs are at risk.

Platform

Platform Team KPIs

Measure platform team effectiveness through service reliability metrics. Track improvements across the services you support.

Compare & Learn

One platform
vs. a stack
of tools

Replace the patchwork of monitoring, logging, tracing, and incident management tools with a single AI-powered platform.

  • No more tab-switching
  • No stale diagrams
  • No manual investigation
Traditional StackApexData
SLO setup

Weeks of manual configuration per service

Every service needs its own SLO defined, thresholds picked, and dashboards built by hand — a project on its own before you've caught a single incident.

SLO setup

Auto-generated from real traffic patterns

ApexData watches actual traffic and generates sensible SLOs automatically — no workshops, no guessing at the right target.

Error budgets

Spreadsheets or custom tooling

Tracking error budget burn usually means a spreadsheet someone updates manually, or a custom script that only one engineer understands.

Error budgets

Real-time tracking with burn-down visualization

Error budgets update live, with a clear burn-down chart showing exactly how much runway is left before you breach your SLO.

Alert quality

Noisy threshold alerts

Static thresholds fire constantly for blips that don't matter, training your team to ignore alerts — right until the one that does matter gets missed.

Alert quality

Burn rate alerts that catch real problems only

Alerts fire based on how fast you're burning error budget, not arbitrary thresholds — so you only get paged when it actually matters.

SLI coverage

Limited to metrics you instrument

If you didn't think to instrument a particular signal, it simply doesn't exist for your SLIs — until it's the exact thing that breaks.

SLI coverage

Automatic SLIs from all traffic signals

Every request, response, and latency signal is captured automatically, so your SLIs reflect everything happening — not just what you remembered to track.

Reporting

Manual report compilation

Someone spends hours every week pulling numbers from three tools into a slide deck nobody looks at until the next incident review.

Reporting

Automated weekly and monthly reports

Reports are generated and delivered on schedule automatically — no compiling, no formatting, no chasing down last week's numbers.

Multi-team

Separate tools per team

Every team picks its own tool, so there's no shared view of reliability across the organization — just a pile of disconnected dashboards.

Multi-team

Unified view across all teams and services

Every team's SLOs live in one place, giving leadership and engineers alike a single source of truth for reliability across the org.

Accuracy

Based on estimated traffic patterns

Without real traffic data, SLOs get set based on guesses and rough estimates — which means they're often wrong from day one.

Accuracy

Based on real traffic — always accurate

SLIs are computed directly from actual production traffic, so your numbers always reflect what's really happening — not an estimate.

Maintenance

Constant tuning of thresholds

As traffic patterns shift, thresholds need constant retuning — a never-ending chore that falls on whoever has time that week.

Maintenance

Self-adjusting as traffic patterns evolve

As traffic evolves, ApexData adjusts automatically — no manual retuning, no stale thresholds quietly drifting out of relevance.

Stop maintaining diagrams.
Start seeing reality.

  • Zero config
  • Real-time
  • Every service, automatically
  • Up in under 1 hour
Book a Demo
Why ApexData

Why engineers choose ApexData

01

Auto-Generated SLOs

No more guessing. SLOs are derived from actual traffic patterns and adjusted as your services evolve. Accuracy you can trust from day one.

02

Burn Rate Intelligence

Multi-window burn rate monitoring catches deteriorating situations before they become outages. Get alerted on real problems, not transient noise.

03

Unified View

All SLOs across all teams in one place. From organization-wide overview to individual service detail — complete reliability visibility.

04

Actionable Budgets

Error budgets that connect to real decisions — prioritize on-call, control releases, and track improvements — all from one platform.

Contact

Get started.
See your systems clearly.
Ship faster

By clicking "Send Message" you agree to our Privacy Policy